Immigrants from Grenada vs Seminole In Labor Force | Age 45-54
COMPARE
Immigrants from Grenada
Seminole
In Labor Force | Age 45-54
In Labor Force | Age 45-54 Comparison
Immigrants from Grenada
Seminole
81.0%
IN LABOR FORCE | AGE 45-54
0.0/ 100
METRIC RATING
281st/ 347
METRIC RANK
78.1%
IN LABOR FORCE | AGE 45-54
0.0/ 100
METRIC RATING
326th/ 347
METRIC RANK
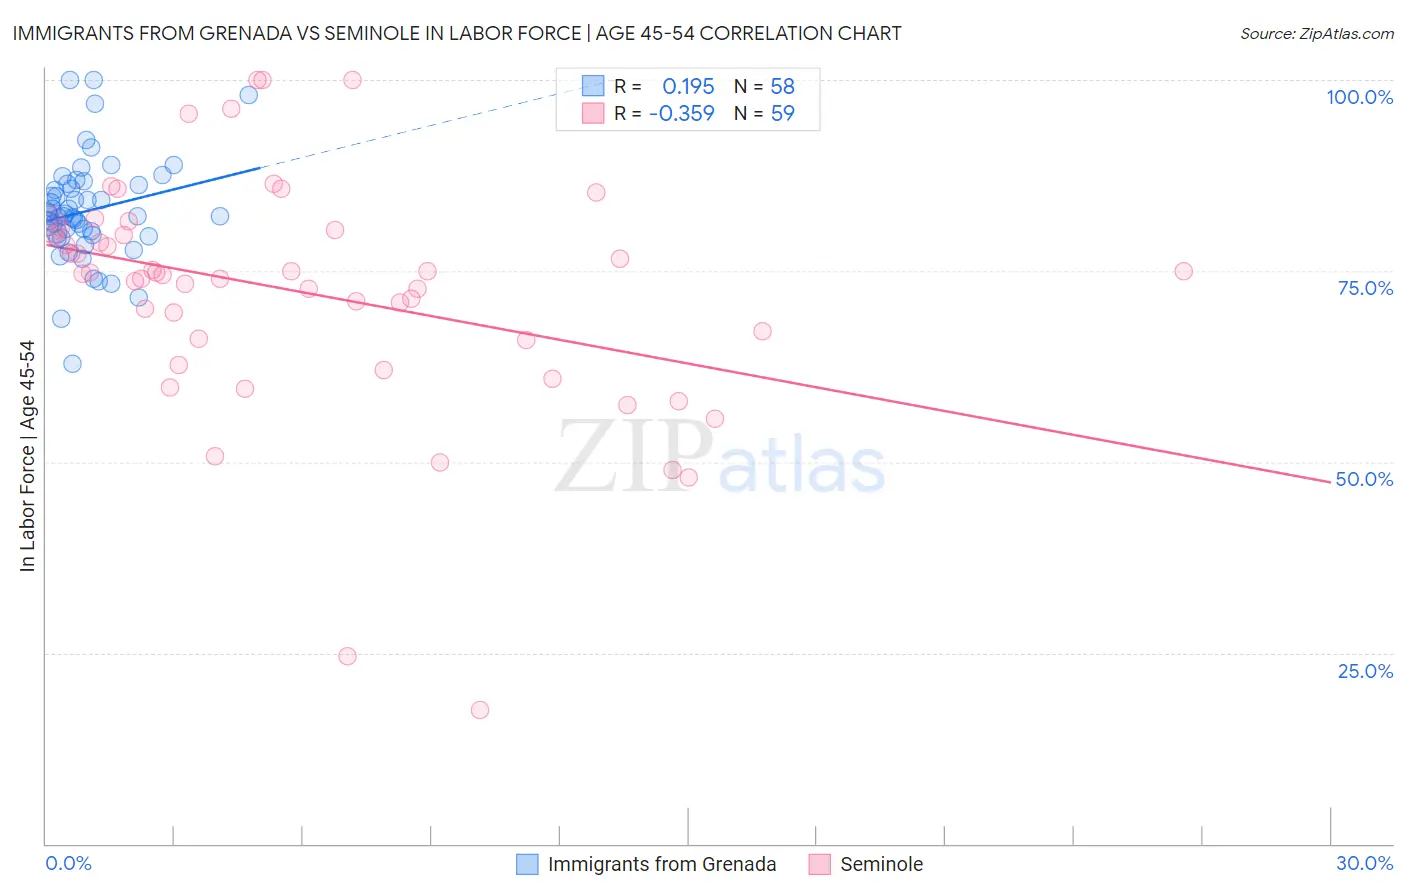
Immigrants from Grenada vs Seminole In Labor Force | Age 45-54 Correlation Chart
The statistical analysis conducted on geographies consisting of 67,184,944 people shows a poor positive correlation between the proportion of Immigrants from Grenada and labor force participation rate among population between the ages 45 and 54 in the United States with a correlation coefficient (R) of 0.195 and weighted average of 81.0%. Similarly, the statistical analysis conducted on geographies consisting of 118,297,106 people shows a mild negative correlation between the proportion of Seminole and labor force participation rate among population between the ages 45 and 54 in the United States with a correlation coefficient (R) of -0.359 and weighted average of 78.1%, a difference of 3.7%.
In Labor Force | Age 45-54 Correlation Summary
| Measurement | Immigrants from Grenada | Seminole |
| Minimum | 62.8% | 17.5% |
| Maximum | 100.0% | 100.0% |
| Range | 37.2% | 82.5% |
| Mean | 82.9% | 72.2% |
| Median | 82.2% | 74.7% |
| Interquartile 25% (IQ1) | 79.7% | 65.9% |
| Interquartile 75% (IQ3) | 86.2% | 80.4% |
| Interquartile Range (IQR) | 6.5% | 14.5% |
| Standard Deviation (Sample) | 6.8% | 15.5% |
| Standard Deviation (Population) | 6.7% | 15.4% |
Similar Demographics by In Labor Force | Age 45-54
Demographics Similar to Immigrants from Grenada by In Labor Force | Age 45-54
In terms of in labor force | age 45-54, the demographic groups most similar to Immigrants from Grenada are Immigrants from Latin America (81.0%, a difference of 0.0%), Aleut (81.0%, a difference of 0.070%), Immigrants from Micronesia (81.1%, a difference of 0.11%), Immigrants from Guatemala (81.1%, a difference of 0.12%), and Guatemalan (81.2%, a difference of 0.20%).
| Demographics | Rating | Rank | In Labor Force | Age 45-54 |
| British West Indians | 0.0 /100 | #274 | Tragic 81.2% |
| Immigrants | Nonimmigrants | 0.0 /100 | #275 | Tragic 81.2% |
| U.S. Virgin Islanders | 0.0 /100 | #276 | Tragic 81.2% |
| Guatemalans | 0.0 /100 | #277 | Tragic 81.2% |
| Immigrants | Guatemala | 0.0 /100 | #278 | Tragic 81.1% |
| Immigrants | Micronesia | 0.0 /100 | #279 | Tragic 81.1% |
| Immigrants | Latin America | 0.0 /100 | #280 | Tragic 81.0% |
| Immigrants | Grenada | 0.0 /100 | #281 | Tragic 81.0% |
| Aleuts | 0.0 /100 | #282 | Tragic 81.0% |
| French American Indians | 0.0 /100 | #283 | Tragic 80.8% |
| Belizeans | 0.0 /100 | #284 | Tragic 80.8% |
| Delaware | 0.0 /100 | #285 | Tragic 80.8% |
| Immigrants | Dominica | 0.0 /100 | #286 | Tragic 80.8% |
| Vietnamese | 0.0 /100 | #287 | Tragic 80.8% |
| Cree | 0.0 /100 | #288 | Tragic 80.8% |
Demographics Similar to Seminole by In Labor Force | Age 45-54
In terms of in labor force | age 45-54, the demographic groups most similar to Seminole are Cajun (78.1%, a difference of 0.0%), Choctaw (78.2%, a difference of 0.050%), Dutch West Indian (78.2%, a difference of 0.14%), Kiowa (78.3%, a difference of 0.16%), and Sioux (78.0%, a difference of 0.23%).
| Demographics | Rating | Rank | In Labor Force | Age 45-54 |
| Cherokee | 0.0 /100 | #319 | Tragic 79.0% |
| Yaqui | 0.0 /100 | #320 | Tragic 78.9% |
| Yup'ik | 0.0 /100 | #321 | Tragic 78.6% |
| Crow | 0.0 /100 | #322 | Tragic 78.3% |
| Kiowa | 0.0 /100 | #323 | Tragic 78.3% |
| Dutch West Indians | 0.0 /100 | #324 | Tragic 78.2% |
| Choctaw | 0.0 /100 | #325 | Tragic 78.2% |
| Seminole | 0.0 /100 | #326 | Tragic 78.1% |
| Cajuns | 0.0 /100 | #327 | Tragic 78.1% |
| Sioux | 0.0 /100 | #328 | Tragic 78.0% |
| Creek | 0.0 /100 | #329 | Tragic 77.7% |
| Cheyenne | 0.0 /100 | #330 | Tragic 77.6% |
| Tsimshian | 0.0 /100 | #331 | Tragic 77.4% |
| Menominee | 0.0 /100 | #332 | Tragic 77.4% |
| Natives/Alaskans | 0.0 /100 | #333 | Tragic 77.1% |