Immigrants from Northern Africa vs Seminole In Labor Force | Age 45-54
COMPARE
Immigrants from Northern Africa
Seminole
In Labor Force | Age 45-54
In Labor Force | Age 45-54 Comparison
Immigrants from Northern Africa
Seminole
83.3%
IN LABOR FORCE | AGE 45-54
95.7/ 100
METRIC RATING
86th/ 347
METRIC RANK
78.1%
IN LABOR FORCE | AGE 45-54
0.0/ 100
METRIC RATING
326th/ 347
METRIC RANK
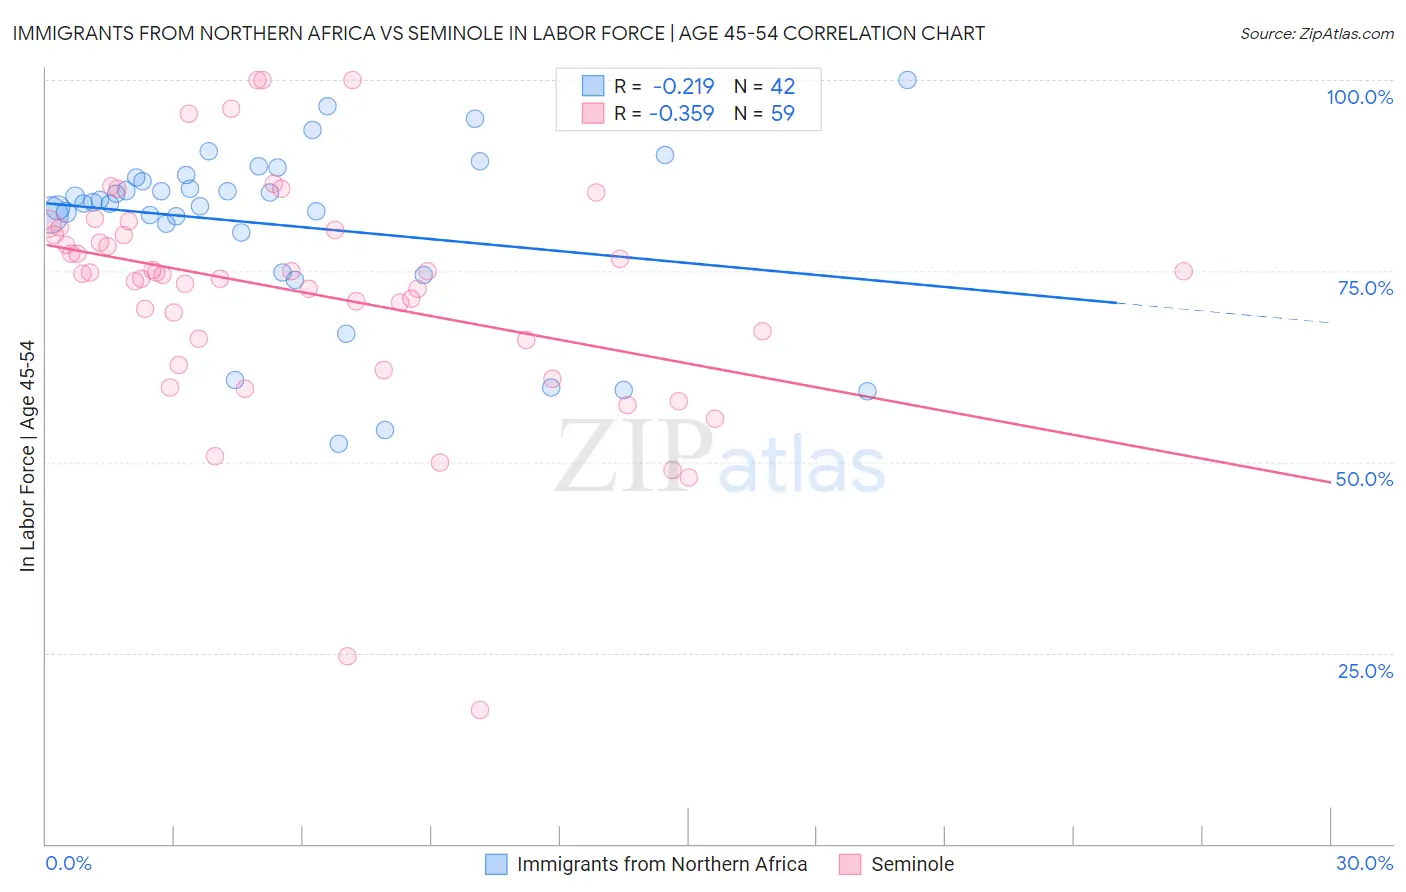
Immigrants from Northern Africa vs Seminole In Labor Force | Age 45-54 Correlation Chart
The statistical analysis conducted on geographies consisting of 321,062,040 people shows a weak negative correlation between the proportion of Immigrants from Northern Africa and labor force participation rate among population between the ages 45 and 54 in the United States with a correlation coefficient (R) of -0.219 and weighted average of 83.3%. Similarly, the statistical analysis conducted on geographies consisting of 118,297,106 people shows a mild negative correlation between the proportion of Seminole and labor force participation rate among population between the ages 45 and 54 in the United States with a correlation coefficient (R) of -0.359 and weighted average of 78.1%, a difference of 6.7%.
In Labor Force | Age 45-54 Correlation Summary
| Measurement | Immigrants from Northern Africa | Seminole |
| Minimum | 52.4% | 17.5% |
| Maximum | 100.0% | 100.0% |
| Range | 47.6% | 82.5% |
| Mean | 81.0% | 72.2% |
| Median | 83.9% | 74.7% |
| Interquartile 25% (IQ1) | 80.1% | 65.9% |
| Interquartile 75% (IQ3) | 87.3% | 80.4% |
| Interquartile Range (IQR) | 7.2% | 14.5% |
| Standard Deviation (Sample) | 11.4% | 15.5% |
| Standard Deviation (Population) | 11.2% | 15.4% |
Similar Demographics by In Labor Force | Age 45-54
Demographics Similar to Immigrants from Northern Africa by In Labor Force | Age 45-54
In terms of in labor force | age 45-54, the demographic groups most similar to Immigrants from Northern Africa are Immigrants from Eastern Europe (83.3%, a difference of 0.0%), Greek (83.3%, a difference of 0.010%), Immigrants from Asia (83.3%, a difference of 0.010%), Indian (Asian) (83.3%, a difference of 0.010%), and Immigrants from Japan (83.3%, a difference of 0.010%).
| Demographics | Rating | Rank | In Labor Force | Age 45-54 |
| Belgians | 96.5 /100 | #79 | Exceptional 83.4% |
| Immigrants | Croatia | 96.5 /100 | #80 | Exceptional 83.4% |
| Jordanians | 96.4 /100 | #81 | Exceptional 83.4% |
| Immigrants | Eastern Asia | 96.3 /100 | #82 | Exceptional 83.4% |
| Immigrants | Zimbabwe | 96.3 /100 | #83 | Exceptional 83.4% |
| Immigrants | Bosnia and Herzegovina | 96.0 /100 | #84 | Exceptional 83.3% |
| Greeks | 95.9 /100 | #85 | Exceptional 83.3% |
| Immigrants | Northern Africa | 95.7 /100 | #86 | Exceptional 83.3% |
| Immigrants | Eastern Europe | 95.6 /100 | #87 | Exceptional 83.3% |
| Immigrants | Asia | 95.6 /100 | #88 | Exceptional 83.3% |
| Indians (Asian) | 95.5 /100 | #89 | Exceptional 83.3% |
| Immigrants | Japan | 95.5 /100 | #90 | Exceptional 83.3% |
| South Americans | 95.5 /100 | #91 | Exceptional 83.3% |
| Danes | 95.3 /100 | #92 | Exceptional 83.3% |
| Italians | 95.1 /100 | #93 | Exceptional 83.3% |
Demographics Similar to Seminole by In Labor Force | Age 45-54
In terms of in labor force | age 45-54, the demographic groups most similar to Seminole are Cajun (78.1%, a difference of 0.0%), Choctaw (78.2%, a difference of 0.050%), Dutch West Indian (78.2%, a difference of 0.14%), Kiowa (78.3%, a difference of 0.16%), and Sioux (78.0%, a difference of 0.23%).
| Demographics | Rating | Rank | In Labor Force | Age 45-54 |
| Cherokee | 0.0 /100 | #319 | Tragic 79.0% |
| Yaqui | 0.0 /100 | #320 | Tragic 78.9% |
| Yup'ik | 0.0 /100 | #321 | Tragic 78.6% |
| Crow | 0.0 /100 | #322 | Tragic 78.3% |
| Kiowa | 0.0 /100 | #323 | Tragic 78.3% |
| Dutch West Indians | 0.0 /100 | #324 | Tragic 78.2% |
| Choctaw | 0.0 /100 | #325 | Tragic 78.2% |
| Seminole | 0.0 /100 | #326 | Tragic 78.1% |
| Cajuns | 0.0 /100 | #327 | Tragic 78.1% |
| Sioux | 0.0 /100 | #328 | Tragic 78.0% |
| Creek | 0.0 /100 | #329 | Tragic 77.7% |
| Cheyenne | 0.0 /100 | #330 | Tragic 77.6% |
| Tsimshian | 0.0 /100 | #331 | Tragic 77.4% |
| Menominee | 0.0 /100 | #332 | Tragic 77.4% |
| Natives/Alaskans | 0.0 /100 | #333 | Tragic 77.1% |