New Zealander vs Immigrants from Nigeria In Labor Force | Age 20-64
COMPARE
New Zealander
Immigrants from Nigeria
In Labor Force | Age 20-64
In Labor Force | Age 20-64 Comparison
New Zealanders
Immigrants from Nigeria
79.7%
IN LABOR FORCE | AGE 20-64
69.4/ 100
METRIC RATING
154th/ 347
METRIC RANK
79.9%
IN LABOR FORCE | AGE 20-64
86.4/ 100
METRIC RATING
138th/ 347
METRIC RANK
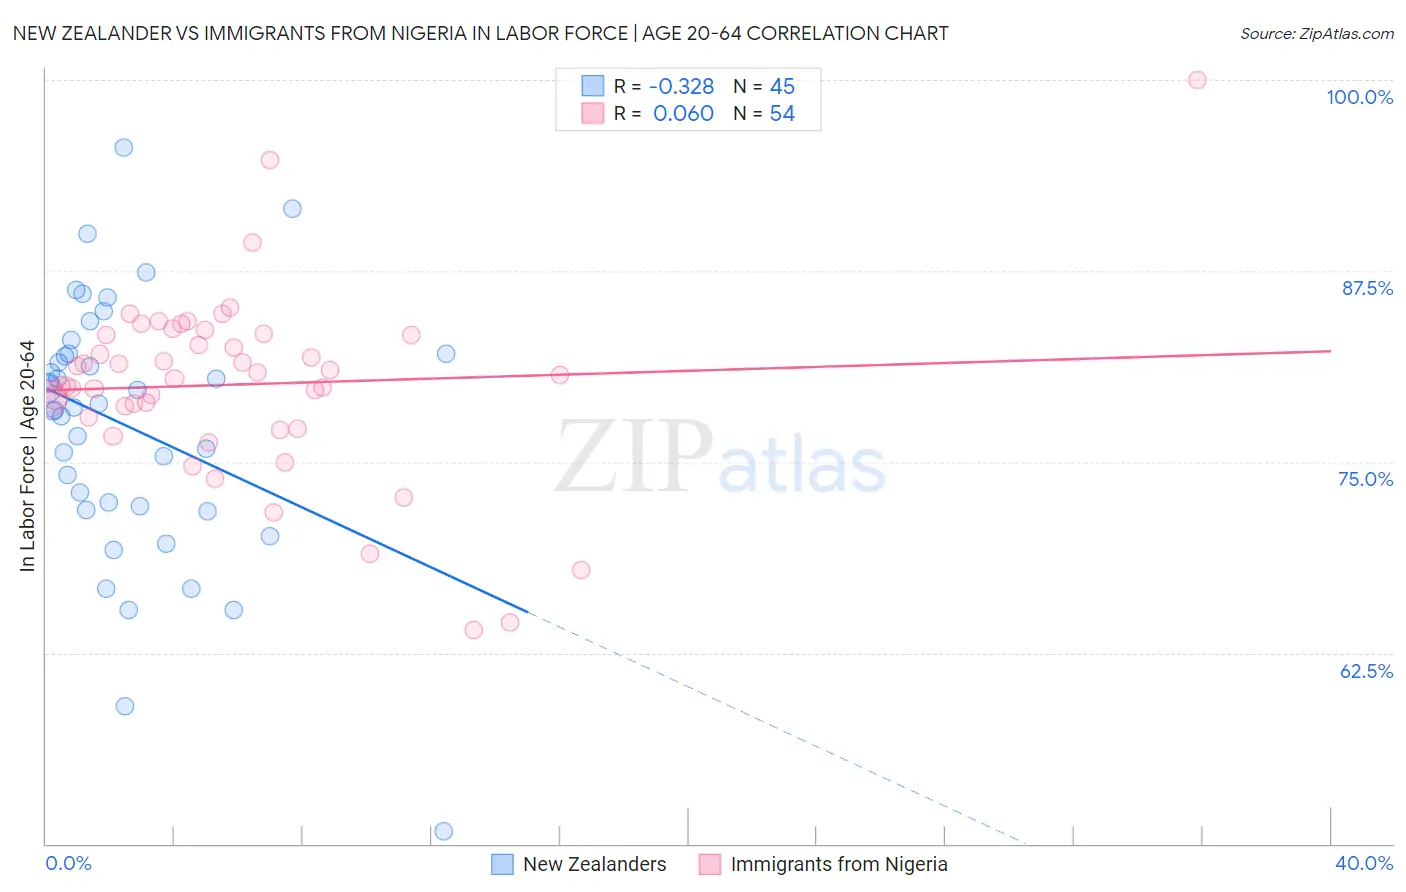
New Zealander vs Immigrants from Nigeria In Labor Force | Age 20-64 Correlation Chart
The statistical analysis conducted on geographies consisting of 106,923,900 people shows a mild negative correlation between the proportion of New Zealanders and labor force participation rate among population between the ages 20 and 64 in the United States with a correlation coefficient (R) of -0.328 and weighted average of 79.7%. Similarly, the statistical analysis conducted on geographies consisting of 283,492,708 people shows a slight positive correlation between the proportion of Immigrants from Nigeria and labor force participation rate among population between the ages 20 and 64 in the United States with a correlation coefficient (R) of 0.060 and weighted average of 79.9%, a difference of 0.21%.
In Labor Force | Age 20-64 Correlation Summary
| Measurement | New Zealander | Immigrants from Nigeria |
| Minimum | 50.8% | 64.0% |
| Maximum | 95.6% | 100.0% |
| Range | 44.8% | 36.0% |
| Mean | 77.3% | 80.1% |
| Median | 78.6% | 80.6% |
| Interquartile 25% (IQ1) | 72.0% | 77.9% |
| Interquartile 75% (IQ3) | 82.1% | 83.3% |
| Interquartile Range (IQR) | 10.1% | 5.4% |
| Standard Deviation (Sample) | 8.5% | 6.1% |
| Standard Deviation (Population) | 8.4% | 6.0% |
Demographics Similar to New Zealanders and Immigrants from Nigeria by In Labor Force | Age 20-64
In terms of in labor force | age 20-64, the demographic groups most similar to New Zealanders are Immigrants from Kazakhstan (79.7%, a difference of 0.0%), Immigrants from South Africa (79.7%, a difference of 0.0%), Senegalese (79.7%, a difference of 0.0%), Immigrants from Northern Europe (79.7%, a difference of 0.020%), and Costa Rican (79.7%, a difference of 0.030%). Similarly, the demographic groups most similar to Immigrants from Nigeria are Immigrants from Ukraine (79.9%, a difference of 0.0%), Immigrants from Singapore (79.9%, a difference of 0.010%), Immigrants from Spain (79.8%, a difference of 0.040%), Immigrants from South Eastern Asia (79.8%, a difference of 0.090%), and Immigrants from Israel (79.8%, a difference of 0.090%).
| Demographics | Rating | Rank | In Labor Force | Age 20-64 |
| Immigrants | Singapore | 86.7 /100 | #136 | Excellent 79.9% |
| Immigrants | Ukraine | 86.5 /100 | #137 | Excellent 79.9% |
| Immigrants | Nigeria | 86.4 /100 | #138 | Excellent 79.9% |
| Immigrants | Spain | 83.9 /100 | #139 | Excellent 79.8% |
| Immigrants | South Eastern Asia | 80.4 /100 | #140 | Excellent 79.8% |
| Immigrants | Israel | 80.0 /100 | #141 | Good 79.8% |
| Slovaks | 79.9 /100 | #142 | Good 79.8% |
| Immigrants | Sweden | 79.7 /100 | #143 | Good 79.8% |
| Koreans | 79.6 /100 | #144 | Good 79.8% |
| Pakistanis | 79.3 /100 | #145 | Good 79.8% |
| Immigrants | Southern Europe | 78.9 /100 | #146 | Good 79.8% |
| Immigrants | Philippines | 78.0 /100 | #147 | Good 79.8% |
| Romanians | 77.6 /100 | #148 | Good 79.8% |
| Icelanders | 75.1 /100 | #149 | Good 79.7% |
| Costa Ricans | 72.4 /100 | #150 | Good 79.7% |
| Scandinavians | 72.0 /100 | #151 | Good 79.7% |
| Immigrants | Northern Europe | 72.0 /100 | #152 | Good 79.7% |
| Immigrants | Kazakhstan | 69.5 /100 | #153 | Good 79.7% |
| New Zealanders | 69.4 /100 | #154 | Good 79.7% |
| Immigrants | South Africa | 69.2 /100 | #155 | Good 79.7% |
| Senegalese | 69.1 /100 | #156 | Good 79.7% |