Nepalese vs Immigrants from Bangladesh In Labor Force | Age 20-24
COMPARE
Nepalese
Immigrants from Bangladesh
In Labor Force | Age 20-24
In Labor Force | Age 20-24 Comparison
Nepalese
Immigrants from Bangladesh
74.5%
IN LABOR FORCE | AGE 20-24
10.5/ 100
METRIC RATING
219th/ 347
METRIC RANK
70.6%
IN LABOR FORCE | AGE 20-24
0.0/ 100
METRIC RATING
331st/ 347
METRIC RANK
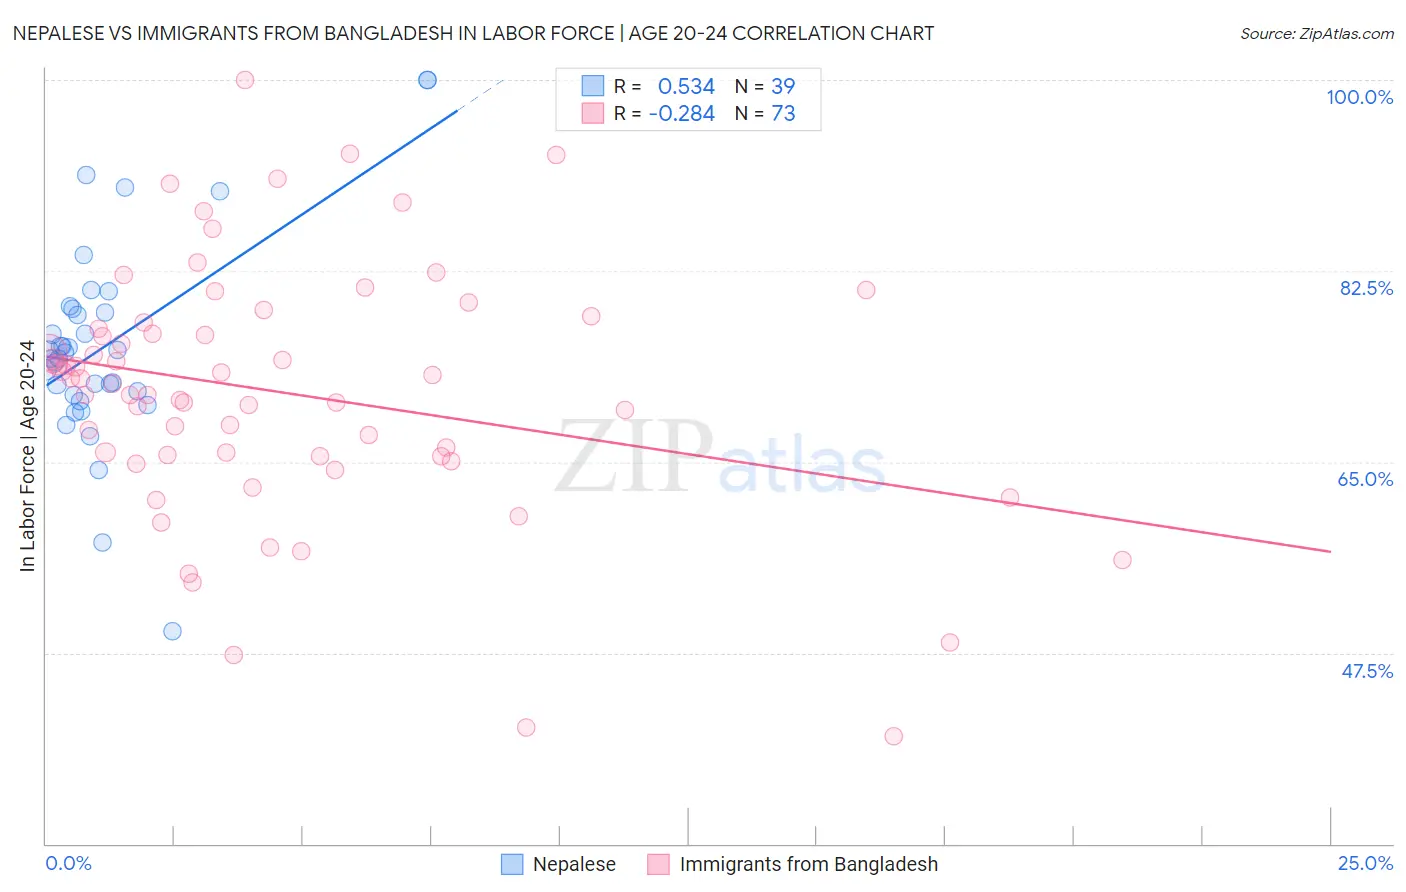
Nepalese vs Immigrants from Bangladesh In Labor Force | Age 20-24 Correlation Chart
The statistical analysis conducted on geographies consisting of 24,516,862 people shows a substantial positive correlation between the proportion of Nepalese and labor force participation rate among population between the ages 20 and 24 in the United States with a correlation coefficient (R) of 0.534 and weighted average of 74.5%. Similarly, the statistical analysis conducted on geographies consisting of 203,671,040 people shows a weak negative correlation between the proportion of Immigrants from Bangladesh and labor force participation rate among population between the ages 20 and 24 in the United States with a correlation coefficient (R) of -0.284 and weighted average of 70.6%, a difference of 5.4%.
In Labor Force | Age 20-24 Correlation Summary
| Measurement | Nepalese | Immigrants from Bangladesh |
| Minimum | 49.5% | 39.8% |
| Maximum | 100.0% | 100.0% |
| Range | 50.5% | 60.2% |
| Mean | 75.7% | 71.3% |
| Median | 75.1% | 72.1% |
| Interquartile 25% (IQ1) | 71.2% | 65.5% |
| Interquartile 75% (IQ3) | 79.0% | 77.5% |
| Interquartile Range (IQR) | 7.9% | 12.0% |
| Standard Deviation (Sample) | 9.6% | 11.5% |
| Standard Deviation (Population) | 9.5% | 11.5% |
Similar Demographics by In Labor Force | Age 20-24
Demographics Similar to Nepalese by In Labor Force | Age 20-24
In terms of in labor force | age 20-24, the demographic groups most similar to Nepalese are Immigrants from Peru (74.5%, a difference of 0.0%), Immigrants from Norway (74.5%, a difference of 0.010%), Chickasaw (74.5%, a difference of 0.010%), Immigrants from India (74.4%, a difference of 0.030%), and Chilean (74.5%, a difference of 0.070%).
| Demographics | Rating | Rank | In Labor Force | Age 20-24 |
| Creek | 13.3 /100 | #212 | Poor 74.5% |
| Peruvians | 13.3 /100 | #213 | Poor 74.5% |
| Immigrants | Southern Europe | 13.2 /100 | #214 | Poor 74.5% |
| Immigrants | Ghana | 12.7 /100 | #215 | Poor 74.5% |
| Immigrants | Kuwait | 12.7 /100 | #216 | Poor 74.5% |
| Chileans | 12.5 /100 | #217 | Poor 74.5% |
| Immigrants | Peru | 10.6 /100 | #218 | Poor 74.5% |
| Nepalese | 10.5 /100 | #219 | Poor 74.5% |
| Immigrants | Norway | 10.3 /100 | #220 | Poor 74.5% |
| Chickasaw | 10.3 /100 | #221 | Poor 74.5% |
| Immigrants | India | 9.9 /100 | #222 | Tragic 74.4% |
| Hispanics or Latinos | 7.9 /100 | #223 | Tragic 74.4% |
| Seminole | 6.9 /100 | #224 | Tragic 74.3% |
| Ghanaians | 6.2 /100 | #225 | Tragic 74.3% |
| Immigrants | Fiji | 5.9 /100 | #226 | Tragic 74.3% |
Demographics Similar to Immigrants from Bangladesh by In Labor Force | Age 20-24
In terms of in labor force | age 20-24, the demographic groups most similar to Immigrants from Bangladesh are Vietnamese (70.6%, a difference of 0.020%), Immigrants from Uzbekistan (70.4%, a difference of 0.30%), Yup'ik (70.9%, a difference of 0.37%), Yuman (70.3%, a difference of 0.53%), and Immigrants from China (71.1%, a difference of 0.61%).
| Demographics | Rating | Rank | In Labor Force | Age 20-24 |
| Immigrants | Dominican Republic | 0.0 /100 | #324 | Tragic 71.2% |
| Barbadians | 0.0 /100 | #325 | Tragic 71.1% |
| Dominicans | 0.0 /100 | #326 | Tragic 71.1% |
| Immigrants | Trinidad and Tobago | 0.0 /100 | #327 | Tragic 71.1% |
| Immigrants | China | 0.0 /100 | #328 | Tragic 71.1% |
| Yup'ik | 0.0 /100 | #329 | Tragic 70.9% |
| Vietnamese | 0.0 /100 | #330 | Tragic 70.6% |
| Immigrants | Bangladesh | 0.0 /100 | #331 | Tragic 70.6% |
| Immigrants | Uzbekistan | 0.0 /100 | #332 | Tragic 70.4% |
| Yuman | 0.0 /100 | #333 | Tragic 70.3% |
| British West Indians | 0.0 /100 | #334 | Tragic 70.0% |
| Immigrants | Barbados | 0.0 /100 | #335 | Tragic 69.7% |
| Immigrants | Guyana | 0.0 /100 | #336 | Tragic 69.3% |
| Guyanese | 0.0 /100 | #337 | Tragic 69.2% |
| Pima | 0.0 /100 | #338 | Tragic 69.0% |