Nepalese vs Scotch-Irish In Labor Force | Age 20-24
COMPARE
Nepalese
Scotch-Irish
In Labor Force | Age 20-24
In Labor Force | Age 20-24 Comparison
Nepalese
Scotch-Irish
74.5%
IN LABOR FORCE | AGE 20-24
10.5/ 100
METRIC RATING
219th/ 347
METRIC RANK
77.0%
IN LABOR FORCE | AGE 20-24
99.9/ 100
METRIC RATING
59th/ 347
METRIC RANK
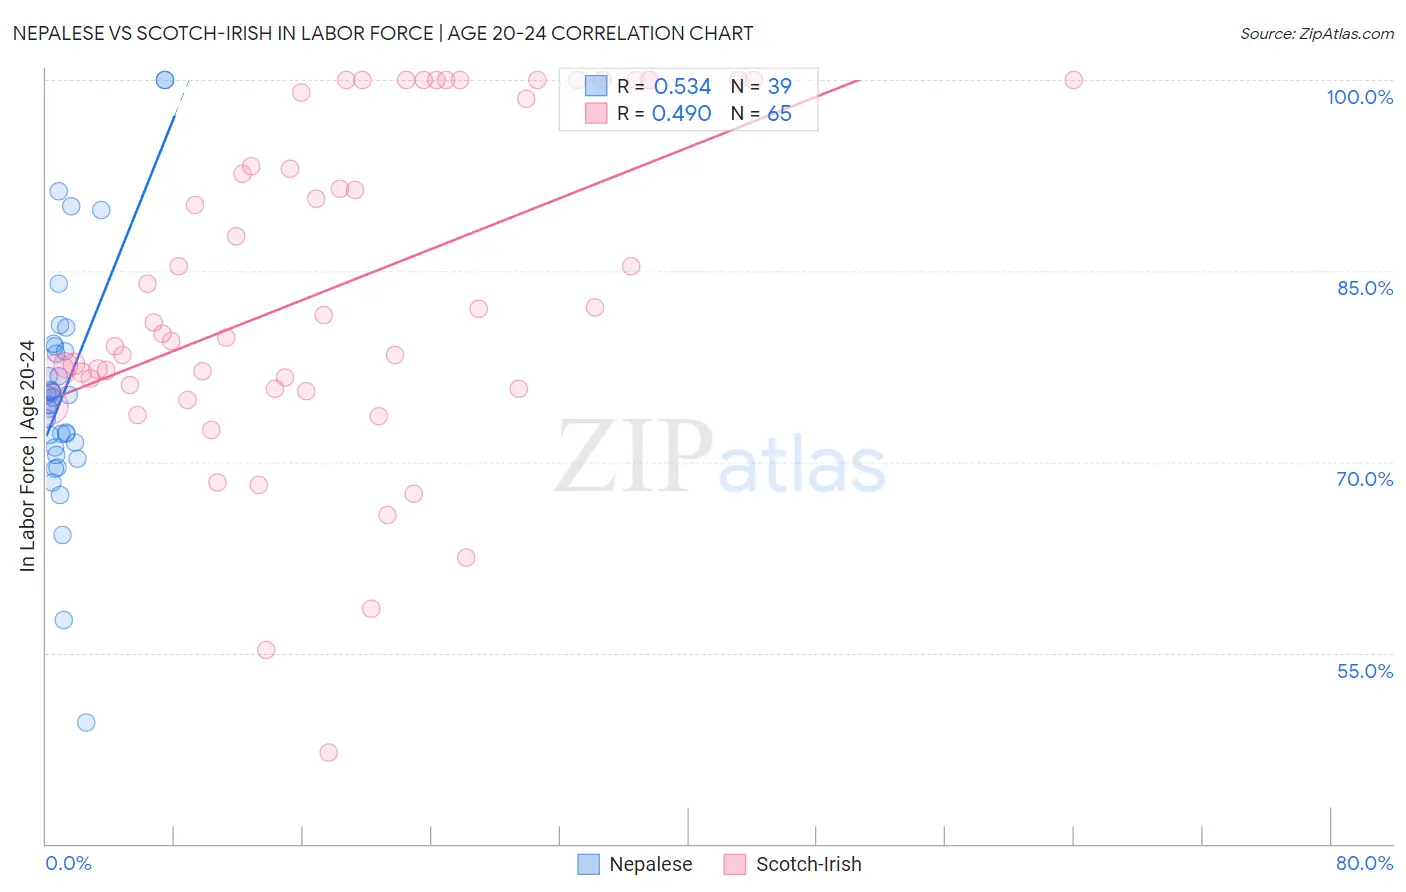
Nepalese vs Scotch-Irish In Labor Force | Age 20-24 Correlation Chart
The statistical analysis conducted on geographies consisting of 24,516,862 people shows a substantial positive correlation between the proportion of Nepalese and labor force participation rate among population between the ages 20 and 24 in the United States with a correlation coefficient (R) of 0.534 and weighted average of 74.5%. Similarly, the statistical analysis conducted on geographies consisting of 547,632,235 people shows a moderate positive correlation between the proportion of Scotch-Irish and labor force participation rate among population between the ages 20 and 24 in the United States with a correlation coefficient (R) of 0.490 and weighted average of 77.0%, a difference of 3.5%.
In Labor Force | Age 20-24 Correlation Summary
| Measurement | Nepalese | Scotch-Irish |
| Minimum | 49.5% | 47.2% |
| Maximum | 100.0% | 100.0% |
| Range | 50.5% | 52.8% |
| Mean | 75.7% | 83.8% |
| Median | 75.1% | 81.0% |
| Interquartile 25% (IQ1) | 71.2% | 75.9% |
| Interquartile 75% (IQ3) | 79.0% | 99.5% |
| Interquartile Range (IQR) | 7.9% | 23.6% |
| Standard Deviation (Sample) | 9.6% | 13.0% |
| Standard Deviation (Population) | 9.5% | 12.9% |
Similar Demographics by In Labor Force | Age 20-24
Demographics Similar to Nepalese by In Labor Force | Age 20-24
In terms of in labor force | age 20-24, the demographic groups most similar to Nepalese are Immigrants from Peru (74.5%, a difference of 0.0%), Immigrants from Norway (74.5%, a difference of 0.010%), Chickasaw (74.5%, a difference of 0.010%), Immigrants from India (74.4%, a difference of 0.030%), and Chilean (74.5%, a difference of 0.070%).
| Demographics | Rating | Rank | In Labor Force | Age 20-24 |
| Creek | 13.3 /100 | #212 | Poor 74.5% |
| Peruvians | 13.3 /100 | #213 | Poor 74.5% |
| Immigrants | Southern Europe | 13.2 /100 | #214 | Poor 74.5% |
| Immigrants | Ghana | 12.7 /100 | #215 | Poor 74.5% |
| Immigrants | Kuwait | 12.7 /100 | #216 | Poor 74.5% |
| Chileans | 12.5 /100 | #217 | Poor 74.5% |
| Immigrants | Peru | 10.6 /100 | #218 | Poor 74.5% |
| Nepalese | 10.5 /100 | #219 | Poor 74.5% |
| Immigrants | Norway | 10.3 /100 | #220 | Poor 74.5% |
| Chickasaw | 10.3 /100 | #221 | Poor 74.5% |
| Immigrants | India | 9.9 /100 | #222 | Tragic 74.4% |
| Hispanics or Latinos | 7.9 /100 | #223 | Tragic 74.4% |
| Seminole | 6.9 /100 | #224 | Tragic 74.3% |
| Ghanaians | 6.2 /100 | #225 | Tragic 74.3% |
| Immigrants | Fiji | 5.9 /100 | #226 | Tragic 74.3% |
Demographics Similar to Scotch-Irish by In Labor Force | Age 20-24
In terms of in labor force | age 20-24, the demographic groups most similar to Scotch-Irish are Hawaiian (77.0%, a difference of 0.030%), Kenyan (77.0%, a difference of 0.040%), Chippewa (77.1%, a difference of 0.050%), European (77.1%, a difference of 0.060%), and Immigrants from Liberia (77.1%, a difference of 0.070%).
| Demographics | Rating | Rank | In Labor Force | Age 20-24 |
| Indonesians | 100.0 /100 | #52 | Exceptional 77.2% |
| Immigrants | Azores | 100.0 /100 | #53 | Exceptional 77.2% |
| Celtics | 99.9 /100 | #54 | Exceptional 77.1% |
| Immigrants | Liberia | 99.9 /100 | #55 | Exceptional 77.1% |
| Europeans | 99.9 /100 | #56 | Exceptional 77.1% |
| Chippewa | 99.9 /100 | #57 | Exceptional 77.1% |
| Hawaiians | 99.9 /100 | #58 | Exceptional 77.0% |
| Scotch-Irish | 99.9 /100 | #59 | Exceptional 77.0% |
| Kenyans | 99.9 /100 | #60 | Exceptional 77.0% |
| Immigrants | Eritrea | 99.9 /100 | #61 | Exceptional 77.0% |
| Immigrants | Kenya | 99.9 /100 | #62 | Exceptional 77.0% |
| Lithuanians | 99.9 /100 | #63 | Exceptional 77.0% |
| Whites/Caucasians | 99.9 /100 | #64 | Exceptional 76.9% |
| Crow | 99.9 /100 | #65 | Exceptional 76.9% |
| Icelanders | 99.9 /100 | #66 | Exceptional 76.9% |