Indonesian vs Basque In Labor Force | Age 25-29
COMPARE
Indonesian
Basque
In Labor Force | Age 25-29
In Labor Force | Age 25-29 Comparison
Indonesians
Basques
84.7%
IN LABOR FORCE | AGE 25-29
56.5/ 100
METRIC RATING
167th/ 347
METRIC RANK
83.4%
IN LABOR FORCE | AGE 25-29
0.0/ 100
METRIC RATING
270th/ 347
METRIC RANK
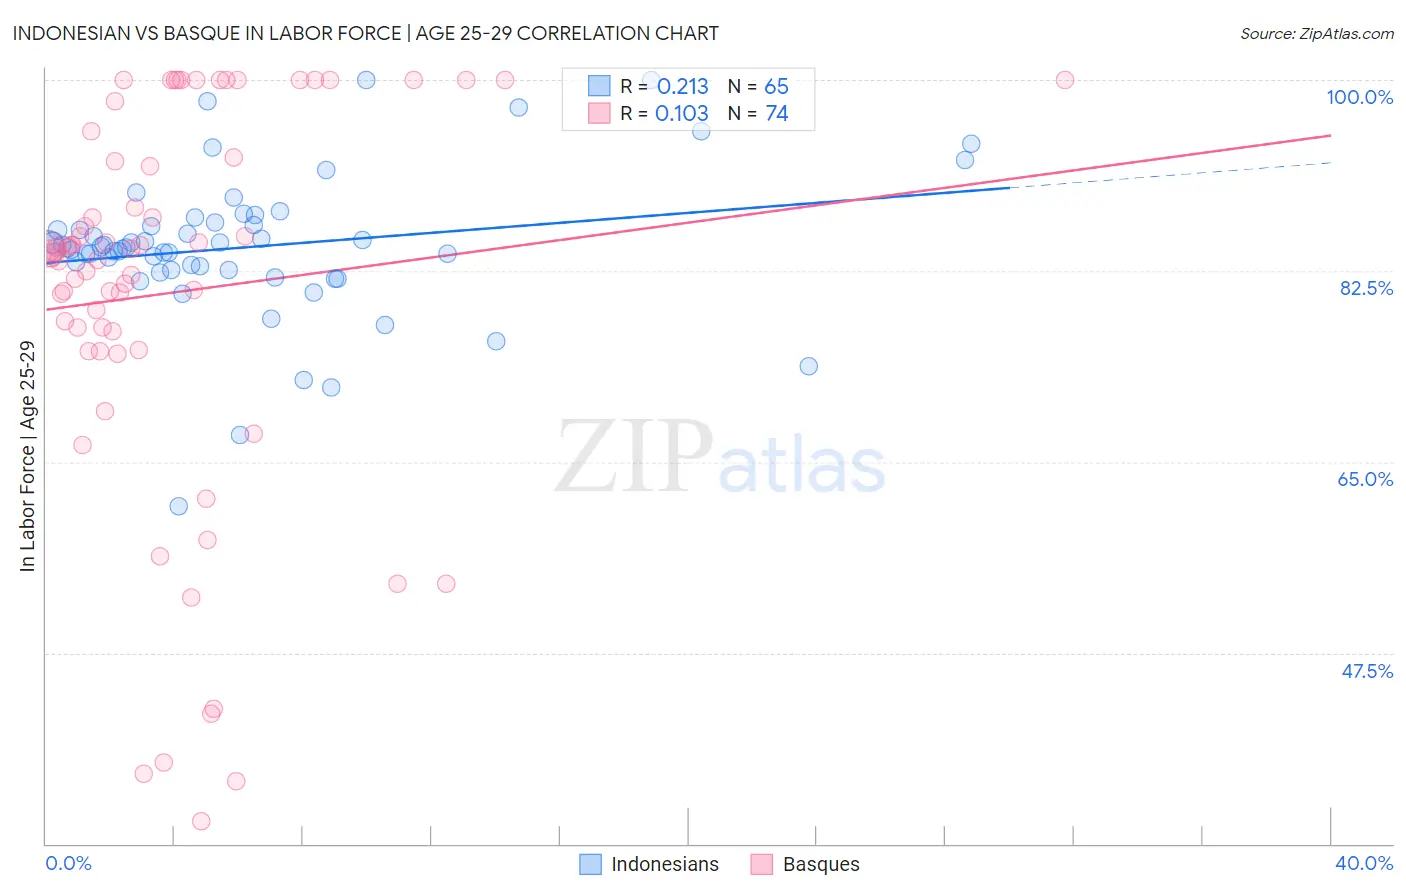
Indonesian vs Basque In Labor Force | Age 25-29 Correlation Chart
The statistical analysis conducted on geographies consisting of 162,720,182 people shows a weak positive correlation between the proportion of Indonesians and labor force participation rate among population between the ages 25 and 29 in the United States with a correlation coefficient (R) of 0.213 and weighted average of 84.7%. Similarly, the statistical analysis conducted on geographies consisting of 165,753,435 people shows a poor positive correlation between the proportion of Basques and labor force participation rate among population between the ages 25 and 29 in the United States with a correlation coefficient (R) of 0.103 and weighted average of 83.4%, a difference of 1.5%.
In Labor Force | Age 25-29 Correlation Summary
| Measurement | Indonesian | Basque |
| Minimum | 61.0% | 32.1% |
| Maximum | 100.0% | 100.0% |
| Range | 39.0% | 67.9% |
| Mean | 84.7% | 80.5% |
| Median | 84.6% | 84.3% |
| Interquartile 25% (IQ1) | 82.6% | 75.3% |
| Interquartile 75% (IQ3) | 86.8% | 92.9% |
| Interquartile Range (IQR) | 4.2% | 17.6% |
| Standard Deviation (Sample) | 6.7% | 17.7% |
| Standard Deviation (Population) | 6.6% | 17.6% |
Similar Demographics by In Labor Force | Age 25-29
Demographics Similar to Indonesians by In Labor Force | Age 25-29
In terms of in labor force | age 25-29, the demographic groups most similar to Indonesians are Immigrants from Spain (84.7%, a difference of 0.0%), Immigrants from Colombia (84.7%, a difference of 0.010%), Argentinean (84.7%, a difference of 0.010%), Ghanaian (84.7%, a difference of 0.010%), and Immigrants from Burma/Myanmar (84.7%, a difference of 0.010%).
| Demographics | Rating | Rank | In Labor Force | Age 25-29 |
| Immigrants | Peru | 58.6 /100 | #160 | Average 84.7% |
| Canadians | 58.5 /100 | #161 | Average 84.7% |
| Immigrants | Colombia | 58.3 /100 | #162 | Average 84.7% |
| Argentineans | 57.9 /100 | #163 | Average 84.7% |
| Ghanaians | 57.6 /100 | #164 | Average 84.7% |
| Immigrants | Burma/Myanmar | 57.4 /100 | #165 | Average 84.7% |
| Immigrants | Spain | 56.9 /100 | #166 | Average 84.7% |
| Indonesians | 56.5 /100 | #167 | Average 84.7% |
| South Americans | 54.9 /100 | #168 | Average 84.7% |
| Celtics | 52.5 /100 | #169 | Average 84.7% |
| Tongans | 52.4 /100 | #170 | Average 84.7% |
| Immigrants | Vietnam | 50.5 /100 | #171 | Average 84.7% |
| Immigrants | Western Europe | 50.4 /100 | #172 | Average 84.7% |
| Assyrians/Chaldeans/Syriacs | 50.2 /100 | #173 | Average 84.7% |
| Palestinians | 50.0 /100 | #174 | Average 84.7% |
Demographics Similar to Basques by In Labor Force | Age 25-29
In terms of in labor force | age 25-29, the demographic groups most similar to Basques are Immigrants from Barbados (83.4%, a difference of 0.010%), Spanish American (83.4%, a difference of 0.020%), Immigrants from Lebanon (83.4%, a difference of 0.020%), Honduran (83.4%, a difference of 0.020%), and Aleut (83.4%, a difference of 0.040%).
| Demographics | Rating | Rank | In Labor Force | Age 25-29 |
| West Indians | 0.1 /100 | #263 | Tragic 83.5% |
| Puget Sound Salish | 0.1 /100 | #264 | Tragic 83.5% |
| Cubans | 0.1 /100 | #265 | Tragic 83.5% |
| Aleuts | 0.0 /100 | #266 | Tragic 83.4% |
| Spanish Americans | 0.0 /100 | #267 | Tragic 83.4% |
| Immigrants | Lebanon | 0.0 /100 | #268 | Tragic 83.4% |
| Immigrants | Barbados | 0.0 /100 | #269 | Tragic 83.4% |
| Basques | 0.0 /100 | #270 | Tragic 83.4% |
| Hondurans | 0.0 /100 | #271 | Tragic 83.4% |
| Immigrants | Caribbean | 0.0 /100 | #272 | Tragic 83.4% |
| Immigrants | Dominica | 0.0 /100 | #273 | Tragic 83.4% |
| Marshallese | 0.0 /100 | #274 | Tragic 83.3% |
| Samoans | 0.0 /100 | #275 | Tragic 83.3% |
| Immigrants | Honduras | 0.0 /100 | #276 | Tragic 83.3% |
| Africans | 0.0 /100 | #277 | Tragic 83.2% |