Immigrants from Belarus vs Basque In Labor Force | Age 25-29
COMPARE
Immigrants from Belarus
Basque
In Labor Force | Age 25-29
In Labor Force | Age 25-29 Comparison
Immigrants from Belarus
Basques
85.0%
IN LABOR FORCE | AGE 25-29
88.0/ 100
METRIC RATING
117th/ 347
METRIC RANK
83.4%
IN LABOR FORCE | AGE 25-29
0.0/ 100
METRIC RATING
270th/ 347
METRIC RANK
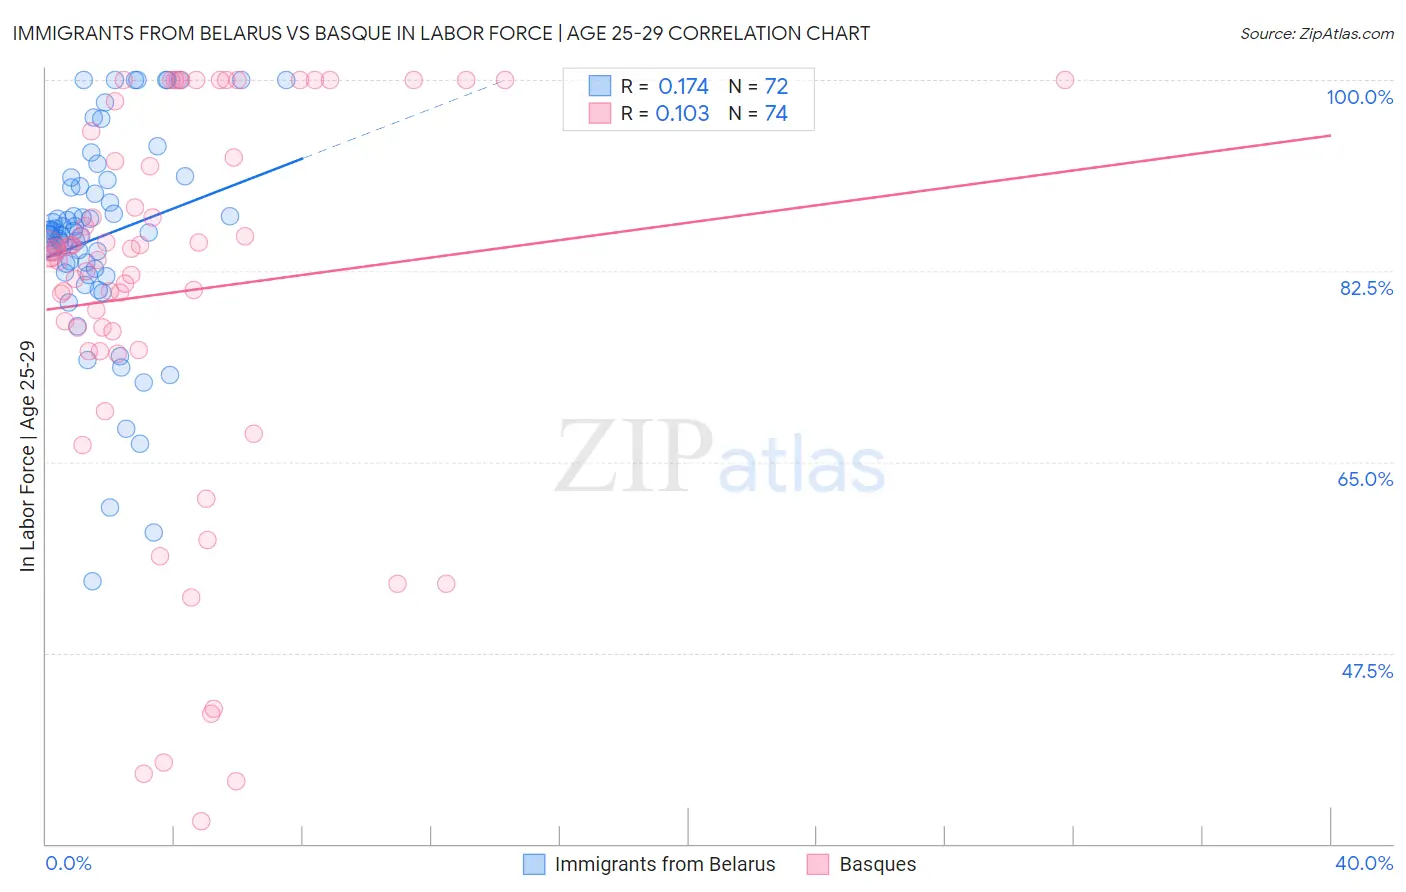
Immigrants from Belarus vs Basque In Labor Force | Age 25-29 Correlation Chart
The statistical analysis conducted on geographies consisting of 150,199,937 people shows a poor positive correlation between the proportion of Immigrants from Belarus and labor force participation rate among population between the ages 25 and 29 in the United States with a correlation coefficient (R) of 0.174 and weighted average of 85.0%. Similarly, the statistical analysis conducted on geographies consisting of 165,753,435 people shows a poor positive correlation between the proportion of Basques and labor force participation rate among population between the ages 25 and 29 in the United States with a correlation coefficient (R) of 0.103 and weighted average of 83.4%, a difference of 1.9%.
In Labor Force | Age 25-29 Correlation Summary
| Measurement | Immigrants from Belarus | Basque |
| Minimum | 54.1% | 32.1% |
| Maximum | 100.0% | 100.0% |
| Range | 45.9% | 67.9% |
| Mean | 85.7% | 80.5% |
| Median | 86.1% | 84.3% |
| Interquartile 25% (IQ1) | 82.5% | 75.3% |
| Interquartile 75% (IQ3) | 90.5% | 92.9% |
| Interquartile Range (IQR) | 8.0% | 17.6% |
| Standard Deviation (Sample) | 9.6% | 17.7% |
| Standard Deviation (Population) | 9.6% | 17.6% |
Similar Demographics by In Labor Force | Age 25-29
Demographics Similar to Immigrants from Belarus by In Labor Force | Age 25-29
In terms of in labor force | age 25-29, the demographic groups most similar to Immigrants from Belarus are Finnish (85.0%, a difference of 0.0%), Filipino (84.9%, a difference of 0.010%), South African (85.0%, a difference of 0.020%), Chilean (85.0%, a difference of 0.020%), and Immigrants from South Africa (84.9%, a difference of 0.030%).
| Demographics | Rating | Rank | In Labor Force | Age 25-29 |
| New Zealanders | 91.5 /100 | #110 | Exceptional 85.0% |
| Immigrants | Middle Africa | 91.4 /100 | #111 | Exceptional 85.0% |
| Senegalese | 90.9 /100 | #112 | Exceptional 85.0% |
| Irish | 90.6 /100 | #113 | Exceptional 85.0% |
| Immigrants | Malaysia | 90.4 /100 | #114 | Exceptional 85.0% |
| South Africans | 88.9 /100 | #115 | Excellent 85.0% |
| Chileans | 88.8 /100 | #116 | Excellent 85.0% |
| Immigrants | Belarus | 88.0 /100 | #117 | Excellent 85.0% |
| Finns | 87.8 /100 | #118 | Excellent 85.0% |
| Filipinos | 87.1 /100 | #119 | Excellent 84.9% |
| Immigrants | South Africa | 86.1 /100 | #120 | Excellent 84.9% |
| Immigrants | Chile | 85.6 /100 | #121 | Excellent 84.9% |
| Scandinavians | 85.1 /100 | #122 | Excellent 84.9% |
| Dutch | 84.9 /100 | #123 | Excellent 84.9% |
| Immigrants | Iran | 84.8 /100 | #124 | Excellent 84.9% |
Demographics Similar to Basques by In Labor Force | Age 25-29
In terms of in labor force | age 25-29, the demographic groups most similar to Basques are Immigrants from Barbados (83.4%, a difference of 0.010%), Spanish American (83.4%, a difference of 0.020%), Immigrants from Lebanon (83.4%, a difference of 0.020%), Honduran (83.4%, a difference of 0.020%), and Aleut (83.4%, a difference of 0.040%).
| Demographics | Rating | Rank | In Labor Force | Age 25-29 |
| West Indians | 0.1 /100 | #263 | Tragic 83.5% |
| Puget Sound Salish | 0.1 /100 | #264 | Tragic 83.5% |
| Cubans | 0.1 /100 | #265 | Tragic 83.5% |
| Aleuts | 0.0 /100 | #266 | Tragic 83.4% |
| Spanish Americans | 0.0 /100 | #267 | Tragic 83.4% |
| Immigrants | Lebanon | 0.0 /100 | #268 | Tragic 83.4% |
| Immigrants | Barbados | 0.0 /100 | #269 | Tragic 83.4% |
| Basques | 0.0 /100 | #270 | Tragic 83.4% |
| Hondurans | 0.0 /100 | #271 | Tragic 83.4% |
| Immigrants | Caribbean | 0.0 /100 | #272 | Tragic 83.4% |
| Immigrants | Dominica | 0.0 /100 | #273 | Tragic 83.4% |
| Marshallese | 0.0 /100 | #274 | Tragic 83.3% |
| Samoans | 0.0 /100 | #275 | Tragic 83.3% |
| Immigrants | Honduras | 0.0 /100 | #276 | Tragic 83.3% |
| Africans | 0.0 /100 | #277 | Tragic 83.2% |