Black/African American vs Salvadoran In Labor Force | Age 20-64
COMPARE
Black/African American
Salvadoran
In Labor Force | Age 20-64
In Labor Force | Age 20-64 Comparison
Blacks/African Americans
Salvadorans
76.8%
IN LABOR FORCE | AGE 20-64
0.0/ 100
METRIC RATING
314th/ 347
METRIC RANK
79.5%
IN LABOR FORCE | AGE 20-64
41.0/ 100
METRIC RATING
180th/ 347
METRIC RANK
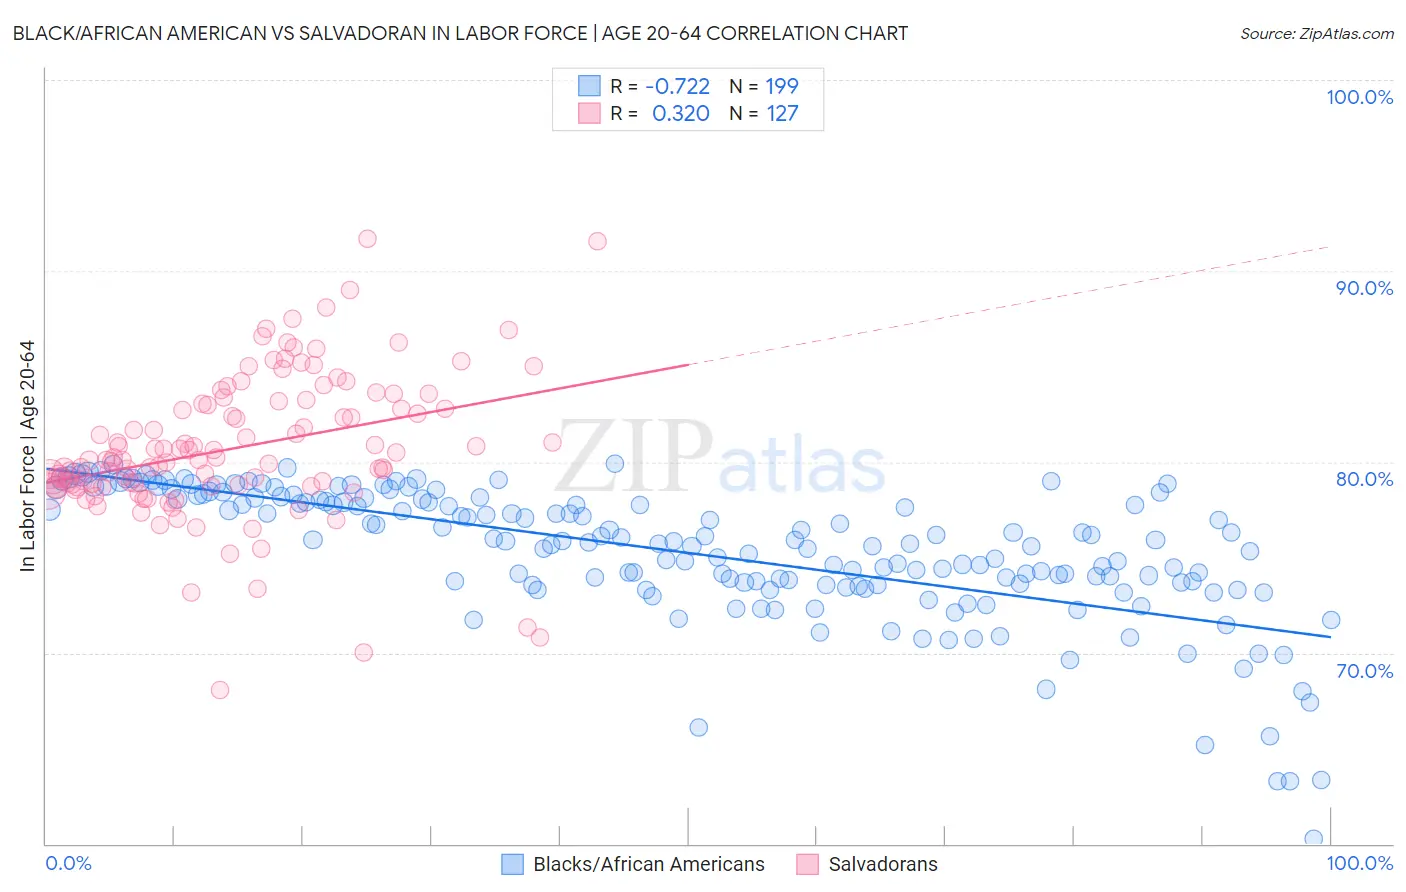
Black/African American vs Salvadoran In Labor Force | Age 20-64 Correlation Chart
The statistical analysis conducted on geographies consisting of 566,027,393 people shows a strong negative correlation between the proportion of Blacks/African Americans and labor force participation rate among population between the ages 20 and 64 in the United States with a correlation coefficient (R) of -0.722 and weighted average of 76.8%. Similarly, the statistical analysis conducted on geographies consisting of 399,020,131 people shows a mild positive correlation between the proportion of Salvadorans and labor force participation rate among population between the ages 20 and 64 in the United States with a correlation coefficient (R) of 0.320 and weighted average of 79.5%, a difference of 3.6%.
In Labor Force | Age 20-64 Correlation Summary
| Measurement | Black/African American | Salvadoran |
| Minimum | 60.2% | 68.0% |
| Maximum | 79.9% | 91.7% |
| Range | 19.7% | 23.7% |
| Mean | 75.3% | 80.7% |
| Median | 75.9% | 80.1% |
| Interquartile 25% (IQ1) | 73.6% | 78.7% |
| Interquartile 75% (IQ3) | 78.1% | 83.2% |
| Interquartile Range (IQR) | 4.5% | 4.5% |
| Standard Deviation (Sample) | 3.5% | 3.8% |
| Standard Deviation (Population) | 3.5% | 3.8% |
Similar Demographics by In Labor Force | Age 20-64
Demographics Similar to Blacks/African Americans by In Labor Force | Age 20-64
In terms of in labor force | age 20-64, the demographic groups most similar to Blacks/African Americans are Shoshone (76.8%, a difference of 0.020%), Ottawa (76.7%, a difference of 0.10%), Alaskan Athabascan (76.9%, a difference of 0.14%), Yaqui (76.5%, a difference of 0.29%), and Blackfeet (77.0%, a difference of 0.31%).
| Demographics | Rating | Rank | In Labor Force | Age 20-64 |
| Central American Indians | 0.0 /100 | #307 | Tragic 77.1% |
| Alaska Natives | 0.0 /100 | #308 | Tragic 77.0% |
| Americans | 0.0 /100 | #309 | Tragic 77.0% |
| Comanche | 0.0 /100 | #310 | Tragic 77.0% |
| Blackfeet | 0.0 /100 | #311 | Tragic 77.0% |
| Alaskan Athabascans | 0.0 /100 | #312 | Tragic 76.9% |
| Shoshone | 0.0 /100 | #313 | Tragic 76.8% |
| Blacks/African Americans | 0.0 /100 | #314 | Tragic 76.8% |
| Ottawa | 0.0 /100 | #315 | Tragic 76.7% |
| Yaqui | 0.0 /100 | #316 | Tragic 76.5% |
| Cherokee | 0.0 /100 | #317 | Tragic 76.2% |
| Chickasaw | 0.0 /100 | #318 | Tragic 76.2% |
| Inupiat | 0.0 /100 | #319 | Tragic 76.1% |
| Yakama | 0.0 /100 | #320 | Tragic 75.8% |
| Seminole | 0.0 /100 | #321 | Tragic 75.5% |
Demographics Similar to Salvadorans by In Labor Force | Age 20-64
In terms of in labor force | age 20-64, the demographic groups most similar to Salvadorans are Armenian (79.5%, a difference of 0.0%), Immigrants from Netherlands (79.5%, a difference of 0.030%), Czechoslovakian (79.5%, a difference of 0.030%), Immigrants from Saudi Arabia (79.5%, a difference of 0.030%), and Malaysian (79.5%, a difference of 0.030%).
| Demographics | Rating | Rank | In Labor Force | Age 20-64 |
| Immigrants | Scotland | 52.4 /100 | #173 | Average 79.6% |
| Syrians | 50.0 /100 | #174 | Average 79.6% |
| Cubans | 46.1 /100 | #175 | Average 79.5% |
| Australians | 46.0 /100 | #176 | Average 79.5% |
| Immigrants | Netherlands | 45.2 /100 | #177 | Average 79.5% |
| Czechoslovakians | 44.3 /100 | #178 | Average 79.5% |
| Armenians | 41.4 /100 | #179 | Average 79.5% |
| Salvadorans | 41.0 /100 | #180 | Average 79.5% |
| Immigrants | Saudi Arabia | 37.7 /100 | #181 | Fair 79.5% |
| Malaysians | 37.1 /100 | #182 | Fair 79.5% |
| Immigrants | Hungary | 36.8 /100 | #183 | Fair 79.5% |
| Finns | 35.9 /100 | #184 | Fair 79.5% |
| Israelis | 34.7 /100 | #185 | Fair 79.5% |
| Northern Europeans | 34.5 /100 | #186 | Fair 79.5% |
| Assyrians/Chaldeans/Syriacs | 33.3 /100 | #187 | Fair 79.4% |