Native Hawaiian vs Yup'ik 12th Grade, No Diploma
COMPARE
Native Hawaiian
Yup'ik
12th Grade, No Diploma
12th Grade, No Diploma Comparison
Native Hawaiians
Yup'ik
92.6%
12TH GRADE, NO DIPLOMA
99.4/ 100
METRIC RATING
75th/ 347
METRIC RANK
87.6%
12TH GRADE, NO DIPLOMA
0.0/ 100
METRIC RATING
308th/ 347
METRIC RANK
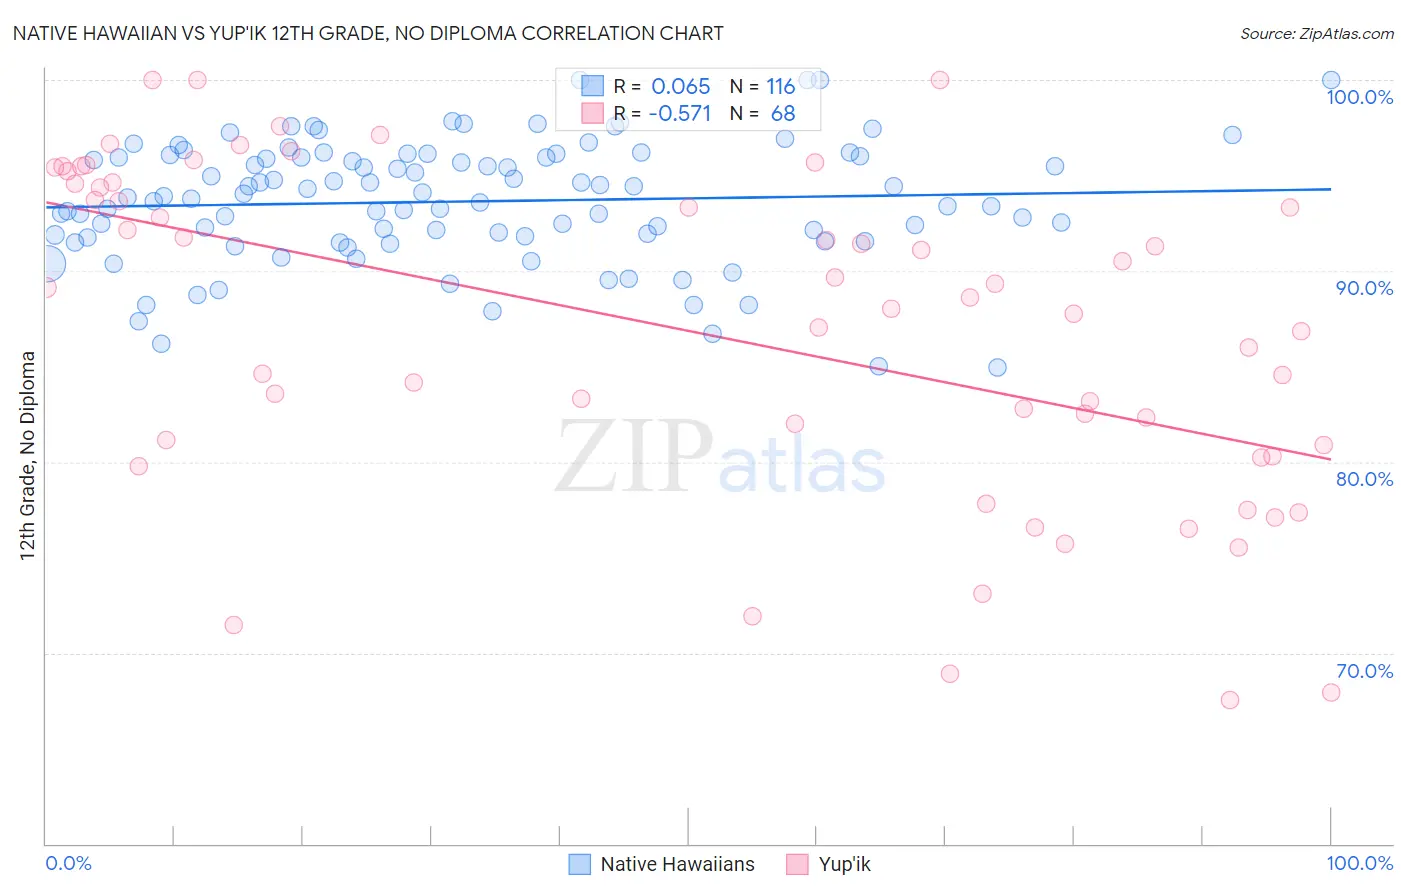
Native Hawaiian vs Yup'ik 12th Grade, No Diploma Correlation Chart
The statistical analysis conducted on geographies consisting of 332,119,254 people shows a slight positive correlation between the proportion of Native Hawaiians and percentage of population with at least 12th grade (no diploma) education in the United States with a correlation coefficient (R) of 0.065 and weighted average of 92.6%. Similarly, the statistical analysis conducted on geographies consisting of 39,964,654 people shows a substantial negative correlation between the proportion of Yup'ik and percentage of population with at least 12th grade (no diploma) education in the United States with a correlation coefficient (R) of -0.571 and weighted average of 87.6%, a difference of 5.7%.
12th Grade, No Diploma Correlation Summary
| Measurement | Native Hawaiian | Yup'ik |
| Minimum | 84.9% | 67.6% |
| Maximum | 100.0% | 100.0% |
| Range | 15.1% | 32.4% |
| Mean | 93.6% | 86.8% |
| Median | 93.9% | 88.3% |
| Interquartile 25% (IQ1) | 91.8% | 80.6% |
| Interquartile 75% (IQ3) | 96.0% | 94.5% |
| Interquartile Range (IQR) | 4.2% | 13.9% |
| Standard Deviation (Sample) | 3.2% | 8.6% |
| Standard Deviation (Population) | 3.2% | 8.5% |
Similar Demographics by 12th Grade, No Diploma
Demographics Similar to Native Hawaiians by 12th Grade, No Diploma
In terms of 12th grade, no diploma, the demographic groups most similar to Native Hawaiians are Burmese (92.6%, a difference of 0.0%), Immigrants from Moldova (92.6%, a difference of 0.0%), French (92.6%, a difference of 0.0%), Immigrants from South Central Asia (92.6%, a difference of 0.020%), and Immigrants from England (92.6%, a difference of 0.020%).
| Demographics | Rating | Rank | 12th Grade, No Diploma |
| Immigrants | Czechoslovakia | 99.5 /100 | #68 | Exceptional 92.7% |
| Immigrants | Iran | 99.5 /100 | #69 | Exceptional 92.7% |
| Czechoslovakians | 99.5 /100 | #70 | Exceptional 92.6% |
| Immigrants | Latvia | 99.5 /100 | #71 | Exceptional 92.6% |
| Immigrants | South Central Asia | 99.5 /100 | #72 | Exceptional 92.6% |
| Burmese | 99.4 /100 | #73 | Exceptional 92.6% |
| Immigrants | Moldova | 99.4 /100 | #74 | Exceptional 92.6% |
| Native Hawaiians | 99.4 /100 | #75 | Exceptional 92.6% |
| French | 99.4 /100 | #76 | Exceptional 92.6% |
| Immigrants | England | 99.4 /100 | #77 | Exceptional 92.6% |
| Cambodians | 99.3 /100 | #78 | Exceptional 92.6% |
| Romanians | 99.3 /100 | #79 | Exceptional 92.6% |
| French Canadians | 99.3 /100 | #80 | Exceptional 92.6% |
| Immigrants | Denmark | 99.2 /100 | #81 | Exceptional 92.5% |
| Immigrants | Switzerland | 99.2 /100 | #82 | Exceptional 92.5% |
Demographics Similar to Yup'ik by 12th Grade, No Diploma
In terms of 12th grade, no diploma, the demographic groups most similar to Yup'ik are Immigrants from Armenia (87.6%, a difference of 0.030%), Immigrants from Portugal (87.6%, a difference of 0.040%), Native/Alaskan (87.7%, a difference of 0.080%), Immigrants from Cuba (87.5%, a difference of 0.080%), and Yaqui (87.5%, a difference of 0.12%).
| Demographics | Rating | Rank | 12th Grade, No Diploma |
| Immigrants | Cambodia | 0.0 /100 | #301 | Tragic 88.1% |
| Ecuadorians | 0.0 /100 | #302 | Tragic 88.0% |
| Immigrants | Bangladesh | 0.0 /100 | #303 | Tragic 88.0% |
| Vietnamese | 0.0 /100 | #304 | Tragic 87.9% |
| Immigrants | Dominica | 0.0 /100 | #305 | Tragic 87.7% |
| Natives/Alaskans | 0.0 /100 | #306 | Tragic 87.7% |
| Immigrants | Portugal | 0.0 /100 | #307 | Tragic 87.6% |
| Yup'ik | 0.0 /100 | #308 | Tragic 87.6% |
| Immigrants | Armenia | 0.0 /100 | #309 | Tragic 87.6% |
| Immigrants | Cuba | 0.0 /100 | #310 | Tragic 87.5% |
| Yaqui | 0.0 /100 | #311 | Tragic 87.5% |
| Immigrants | Ecuador | 0.0 /100 | #312 | Tragic 87.5% |
| Immigrants | Caribbean | 0.0 /100 | #313 | Tragic 87.4% |
| Cape Verdeans | 0.0 /100 | #314 | Tragic 87.4% |
| Nicaraguans | 0.0 /100 | #315 | Tragic 87.3% |