Native Hawaiian vs Nicaraguan In Labor Force | Age 16-19
COMPARE
Native Hawaiian
Nicaraguan
In Labor Force | Age 16-19
In Labor Force | Age 16-19 Comparison
Native Hawaiians
Nicaraguans
37.4%
IN LABOR FORCE | AGE 16-19
85.0/ 100
METRIC RATING
149th/ 347
METRIC RANK
32.4%
IN LABOR FORCE | AGE 16-19
0.0/ 100
METRIC RATING
305th/ 347
METRIC RANK
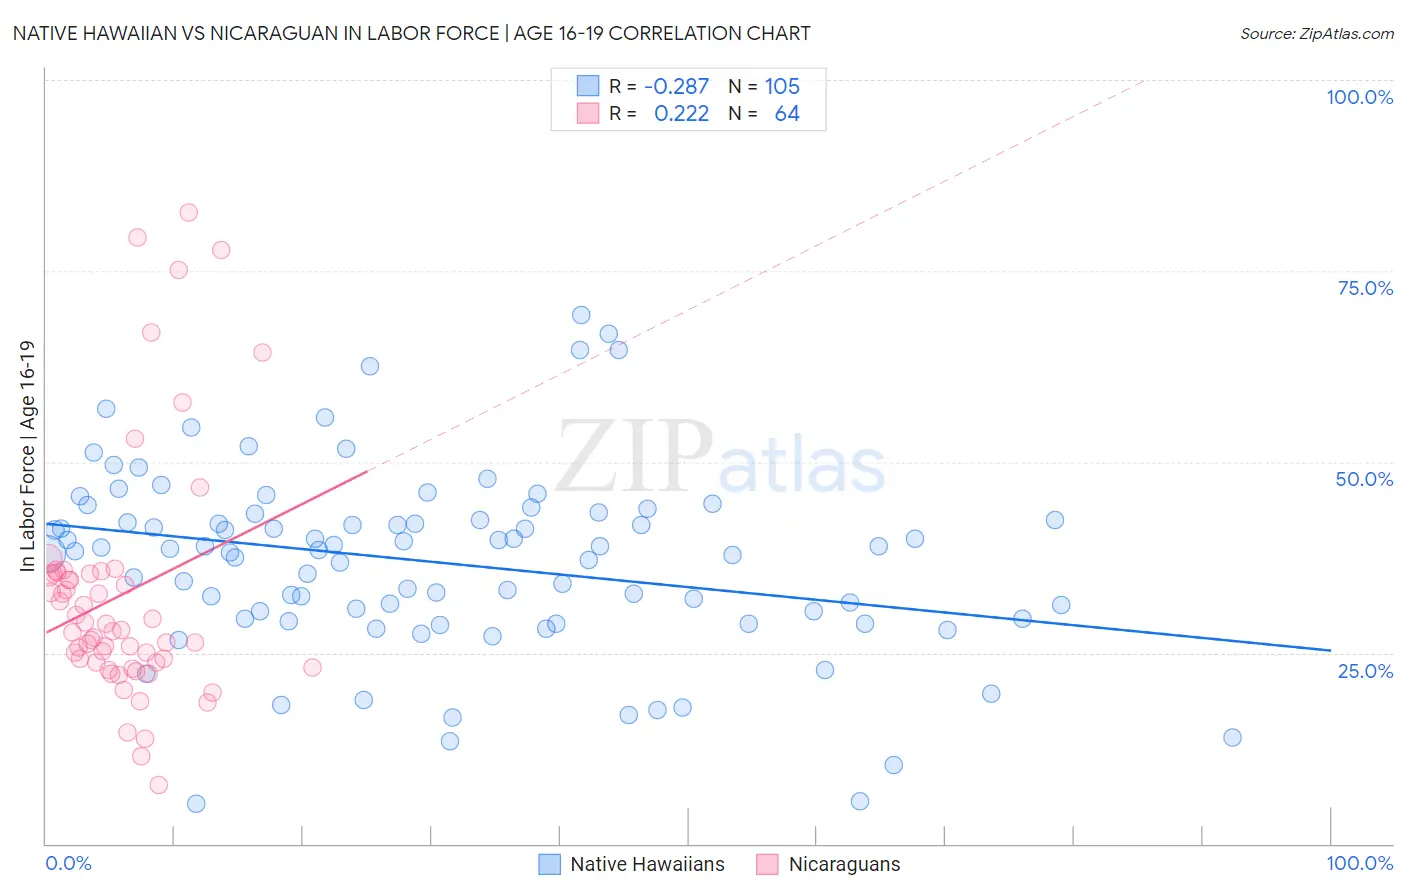
Native Hawaiian vs Nicaraguan In Labor Force | Age 16-19 Correlation Chart
The statistical analysis conducted on geographies consisting of 331,673,637 people shows a weak negative correlation between the proportion of Native Hawaiians and labor force participation rate among population between the ages 16 and 19 in the United States with a correlation coefficient (R) of -0.287 and weighted average of 37.4%. Similarly, the statistical analysis conducted on geographies consisting of 285,526,863 people shows a weak positive correlation between the proportion of Nicaraguans and labor force participation rate among population between the ages 16 and 19 in the United States with a correlation coefficient (R) of 0.222 and weighted average of 32.4%, a difference of 15.3%.
In Labor Force | Age 16-19 Correlation Summary
| Measurement | Native Hawaiian | Nicaraguan |
| Minimum | 5.3% | 7.7% |
| Maximum | 69.2% | 82.6% |
| Range | 63.9% | 74.9% |
| Mean | 36.8% | 32.6% |
| Median | 38.4% | 27.9% |
| Interquartile 25% (IQ1) | 29.4% | 23.7% |
| Interquartile 75% (IQ3) | 42.8% | 35.4% |
| Interquartile Range (IQR) | 13.3% | 11.7% |
| Standard Deviation (Sample) | 12.2% | 16.0% |
| Standard Deviation (Population) | 12.2% | 15.9% |
Similar Demographics by In Labor Force | Age 16-19
Demographics Similar to Native Hawaiians by In Labor Force | Age 16-19
In terms of in labor force | age 16-19, the demographic groups most similar to Native Hawaiians are Tsimshian (37.4%, a difference of 0.030%), Immigrants from Poland (37.3%, a difference of 0.050%), Immigrants from Sierra Leone (37.3%, a difference of 0.13%), Romanian (37.5%, a difference of 0.24%), and Arapaho (37.3%, a difference of 0.28%).
| Demographics | Rating | Rank | In Labor Force | Age 16-19 |
| Sierra Leoneans | 89.7 /100 | #142 | Excellent 37.6% |
| Pakistanis | 89.5 /100 | #143 | Excellent 37.6% |
| Japanese | 89.3 /100 | #144 | Excellent 37.5% |
| Paiute | 89.3 /100 | #145 | Excellent 37.5% |
| Immigrants | Western Europe | 88.9 /100 | #146 | Excellent 37.5% |
| Brazilians | 88.7 /100 | #147 | Excellent 37.5% |
| Romanians | 87.3 /100 | #148 | Excellent 37.5% |
| Native Hawaiians | 85.0 /100 | #149 | Excellent 37.4% |
| Tsimshian | 84.7 /100 | #150 | Excellent 37.4% |
| Immigrants | Poland | 84.4 /100 | #151 | Excellent 37.3% |
| Immigrants | Sierra Leone | 83.6 /100 | #152 | Excellent 37.3% |
| Arapaho | 81.8 /100 | #153 | Excellent 37.3% |
| Immigrants | Bulgaria | 81.6 /100 | #154 | Excellent 37.3% |
| Immigrants | Lithuania | 80.7 /100 | #155 | Excellent 37.2% |
| Kiowa | 80.4 /100 | #156 | Excellent 37.2% |
Demographics Similar to Nicaraguans by In Labor Force | Age 16-19
In terms of in labor force | age 16-19, the demographic groups most similar to Nicaraguans are Israeli (32.4%, a difference of 0.050%), Spanish American Indian (32.4%, a difference of 0.13%), Immigrants from Dominica (32.5%, a difference of 0.24%), Immigrants from Jamaica (32.2%, a difference of 0.62%), and Navajo (32.1%, a difference of 0.97%).
| Demographics | Rating | Rank | In Labor Force | Age 16-19 |
| Iranians | 0.0 /100 | #298 | Tragic 33.0% |
| Armenians | 0.0 /100 | #299 | Tragic 32.9% |
| Immigrants | Argentina | 0.0 /100 | #300 | Tragic 32.9% |
| Okinawans | 0.0 /100 | #301 | Tragic 32.8% |
| Belizeans | 0.0 /100 | #302 | Tragic 32.8% |
| Immigrants | Dominica | 0.0 /100 | #303 | Tragic 32.5% |
| Israelis | 0.0 /100 | #304 | Tragic 32.4% |
| Nicaraguans | 0.0 /100 | #305 | Tragic 32.4% |
| Spanish American Indians | 0.0 /100 | #306 | Tragic 32.4% |
| Immigrants | Jamaica | 0.0 /100 | #307 | Tragic 32.2% |
| Navajo | 0.0 /100 | #308 | Tragic 32.1% |
| Immigrants | Eastern Asia | 0.0 /100 | #309 | Tragic 32.0% |
| Immigrants | Iran | 0.0 /100 | #310 | Tragic 32.0% |
| Indians (Asian) | 0.0 /100 | #311 | Tragic 31.9% |
| Immigrants | Belize | 0.0 /100 | #312 | Tragic 31.8% |