Immigrants from China vs Nicaraguan In Labor Force | Age 16-19
COMPARE
Immigrants from China
Nicaraguan
In Labor Force | Age 16-19
In Labor Force | Age 16-19 Comparison
Immigrants from China
Nicaraguans
31.1%
IN LABOR FORCE | AGE 16-19
0.0/ 100
METRIC RATING
325th/ 347
METRIC RANK
32.4%
IN LABOR FORCE | AGE 16-19
0.0/ 100
METRIC RATING
305th/ 347
METRIC RANK
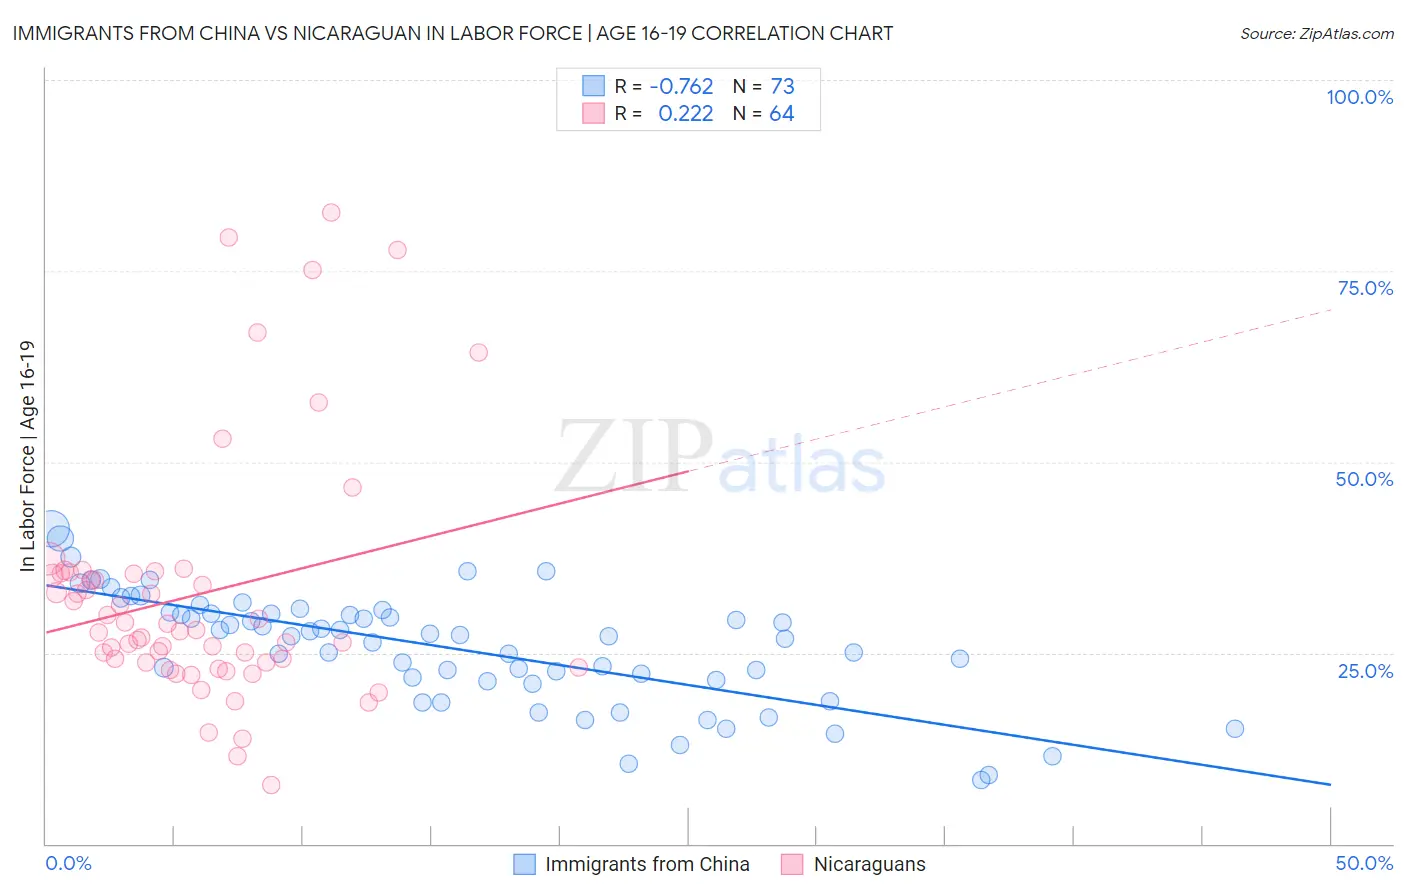
Immigrants from China vs Nicaraguan In Labor Force | Age 16-19 Correlation Chart
The statistical analysis conducted on geographies consisting of 456,166,794 people shows a strong negative correlation between the proportion of Immigrants from China and labor force participation rate among population between the ages 16 and 19 in the United States with a correlation coefficient (R) of -0.762 and weighted average of 31.1%. Similarly, the statistical analysis conducted on geographies consisting of 285,526,863 people shows a weak positive correlation between the proportion of Nicaraguans and labor force participation rate among population between the ages 16 and 19 in the United States with a correlation coefficient (R) of 0.222 and weighted average of 32.4%, a difference of 4.0%.
In Labor Force | Age 16-19 Correlation Summary
| Measurement | Immigrants from China | Nicaraguan |
| Minimum | 8.3% | 7.7% |
| Maximum | 41.3% | 82.6% |
| Range | 33.0% | 74.9% |
| Mean | 25.6% | 32.6% |
| Median | 27.2% | 27.9% |
| Interquartile 25% (IQ1) | 21.3% | 23.7% |
| Interquartile 75% (IQ3) | 30.2% | 35.4% |
| Interquartile Range (IQR) | 8.8% | 11.7% |
| Standard Deviation (Sample) | 7.3% | 16.0% |
| Standard Deviation (Population) | 7.3% | 15.9% |
Demographics Similar to Immigrants from China and Nicaraguans by In Labor Force | Age 16-19
In terms of in labor force | age 16-19, the demographic groups most similar to Immigrants from China are Dominican (31.2%, a difference of 0.15%), Immigrants from Caribbean (31.2%, a difference of 0.33%), Tohono O'odham (31.3%, a difference of 0.46%), West Indian (31.3%, a difference of 0.58%), and Ecuadorian (31.4%, a difference of 0.81%). Similarly, the demographic groups most similar to Nicaraguans are Spanish American Indian (32.4%, a difference of 0.13%), Immigrants from Jamaica (32.2%, a difference of 0.62%), Navajo (32.1%, a difference of 0.97%), Immigrants from Eastern Asia (32.0%, a difference of 1.1%), and Immigrants from Iran (32.0%, a difference of 1.3%).
| Demographics | Rating | Rank | In Labor Force | Age 16-19 |
| Nicaraguans | 0.0 /100 | #305 | Tragic 32.4% |
| Spanish American Indians | 0.0 /100 | #306 | Tragic 32.4% |
| Immigrants | Jamaica | 0.0 /100 | #307 | Tragic 32.2% |
| Navajo | 0.0 /100 | #308 | Tragic 32.1% |
| Immigrants | Eastern Asia | 0.0 /100 | #309 | Tragic 32.0% |
| Immigrants | Iran | 0.0 /100 | #310 | Tragic 32.0% |
| Indians (Asian) | 0.0 /100 | #311 | Tragic 31.9% |
| Immigrants | Belize | 0.0 /100 | #312 | Tragic 31.8% |
| Hopi | 0.0 /100 | #313 | Tragic 31.8% |
| Cubans | 0.0 /100 | #314 | Tragic 31.8% |
| Immigrants | West Indies | 0.0 /100 | #315 | Tragic 31.7% |
| Filipinos | 0.0 /100 | #316 | Tragic 31.7% |
| Immigrants | Nicaragua | 0.0 /100 | #317 | Tragic 31.6% |
| Immigrants | Yemen | 0.0 /100 | #318 | Tragic 31.5% |
| Soviet Union | 0.0 /100 | #319 | Tragic 31.4% |
| Ecuadorians | 0.0 /100 | #320 | Tragic 31.4% |
| West Indians | 0.0 /100 | #321 | Tragic 31.3% |
| Tohono O'odham | 0.0 /100 | #322 | Tragic 31.3% |
| Immigrants | Caribbean | 0.0 /100 | #323 | Tragic 31.2% |
| Dominicans | 0.0 /100 | #324 | Tragic 31.2% |
| Immigrants | China | 0.0 /100 | #325 | Tragic 31.1% |