Native Hawaiian vs Immigrants from Taiwan In Labor Force | Age 16-19
COMPARE
Native Hawaiian
Immigrants from Taiwan
In Labor Force | Age 16-19
In Labor Force | Age 16-19 Comparison
Native Hawaiians
Immigrants from Taiwan
37.4%
IN LABOR FORCE | AGE 16-19
85.0/ 100
METRIC RATING
149th/ 347
METRIC RANK
31.0%
IN LABOR FORCE | AGE 16-19
0.0/ 100
METRIC RATING
327th/ 347
METRIC RANK
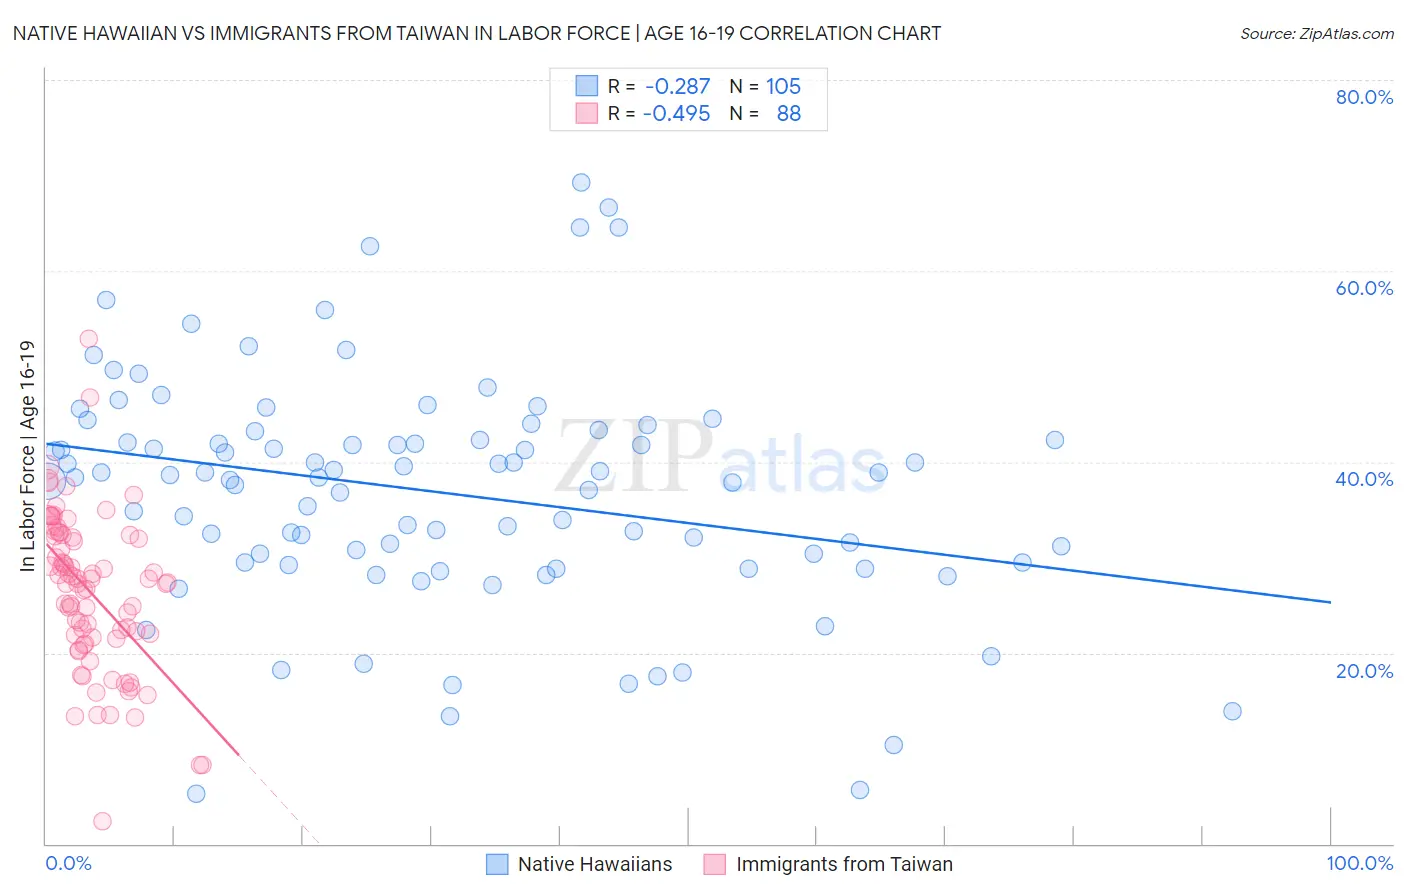
Native Hawaiian vs Immigrants from Taiwan In Labor Force | Age 16-19 Correlation Chart
The statistical analysis conducted on geographies consisting of 331,673,637 people shows a weak negative correlation between the proportion of Native Hawaiians and labor force participation rate among population between the ages 16 and 19 in the United States with a correlation coefficient (R) of -0.287 and weighted average of 37.4%. Similarly, the statistical analysis conducted on geographies consisting of 297,913,482 people shows a moderate negative correlation between the proportion of Immigrants from Taiwan and labor force participation rate among population between the ages 16 and 19 in the United States with a correlation coefficient (R) of -0.495 and weighted average of 31.0%, a difference of 20.4%.
In Labor Force | Age 16-19 Correlation Summary
| Measurement | Native Hawaiian | Immigrants from Taiwan |
| Minimum | 5.3% | 2.3% |
| Maximum | 69.2% | 52.9% |
| Range | 63.9% | 50.6% |
| Mean | 36.8% | 26.3% |
| Median | 38.4% | 27.3% |
| Interquartile 25% (IQ1) | 29.4% | 21.5% |
| Interquartile 75% (IQ3) | 42.8% | 32.3% |
| Interquartile Range (IQR) | 13.3% | 10.7% |
| Standard Deviation (Sample) | 12.2% | 8.3% |
| Standard Deviation (Population) | 12.2% | 8.2% |
Similar Demographics by In Labor Force | Age 16-19
Demographics Similar to Native Hawaiians by In Labor Force | Age 16-19
In terms of in labor force | age 16-19, the demographic groups most similar to Native Hawaiians are Tsimshian (37.4%, a difference of 0.030%), Immigrants from Poland (37.3%, a difference of 0.050%), Immigrants from Sierra Leone (37.3%, a difference of 0.13%), Romanian (37.5%, a difference of 0.24%), and Arapaho (37.3%, a difference of 0.28%).
| Demographics | Rating | Rank | In Labor Force | Age 16-19 |
| Sierra Leoneans | 89.7 /100 | #142 | Excellent 37.6% |
| Pakistanis | 89.5 /100 | #143 | Excellent 37.6% |
| Japanese | 89.3 /100 | #144 | Excellent 37.5% |
| Paiute | 89.3 /100 | #145 | Excellent 37.5% |
| Immigrants | Western Europe | 88.9 /100 | #146 | Excellent 37.5% |
| Brazilians | 88.7 /100 | #147 | Excellent 37.5% |
| Romanians | 87.3 /100 | #148 | Excellent 37.5% |
| Native Hawaiians | 85.0 /100 | #149 | Excellent 37.4% |
| Tsimshian | 84.7 /100 | #150 | Excellent 37.4% |
| Immigrants | Poland | 84.4 /100 | #151 | Excellent 37.3% |
| Immigrants | Sierra Leone | 83.6 /100 | #152 | Excellent 37.3% |
| Arapaho | 81.8 /100 | #153 | Excellent 37.3% |
| Immigrants | Bulgaria | 81.6 /100 | #154 | Excellent 37.3% |
| Immigrants | Lithuania | 80.7 /100 | #155 | Excellent 37.2% |
| Kiowa | 80.4 /100 | #156 | Excellent 37.2% |
Demographics Similar to Immigrants from Taiwan by In Labor Force | Age 16-19
In terms of in labor force | age 16-19, the demographic groups most similar to Immigrants from Taiwan are Immigrants from Ecuador (31.0%, a difference of 0.040%), Barbadian (31.0%, a difference of 0.070%), Immigrants from Dominican Republic (31.1%, a difference of 0.16%), Lumbee (31.0%, a difference of 0.19%), and Trinidadian and Tobagonian (30.9%, a difference of 0.34%).
| Demographics | Rating | Rank | In Labor Force | Age 16-19 |
| Ecuadorians | 0.0 /100 | #320 | Tragic 31.4% |
| West Indians | 0.0 /100 | #321 | Tragic 31.3% |
| Tohono O'odham | 0.0 /100 | #322 | Tragic 31.3% |
| Immigrants | Caribbean | 0.0 /100 | #323 | Tragic 31.2% |
| Dominicans | 0.0 /100 | #324 | Tragic 31.2% |
| Immigrants | China | 0.0 /100 | #325 | Tragic 31.1% |
| Immigrants | Dominican Republic | 0.0 /100 | #326 | Tragic 31.1% |
| Immigrants | Taiwan | 0.0 /100 | #327 | Tragic 31.0% |
| Immigrants | Ecuador | 0.0 /100 | #328 | Tragic 31.0% |
| Barbadians | 0.0 /100 | #329 | Tragic 31.0% |
| Lumbee | 0.0 /100 | #330 | Tragic 31.0% |
| Trinidadians and Tobagonians | 0.0 /100 | #331 | Tragic 30.9% |
| Immigrants | Israel | 0.0 /100 | #332 | Tragic 30.5% |
| Immigrants | Hong Kong | 0.0 /100 | #333 | Tragic 30.5% |
| Puerto Ricans | 0.0 /100 | #334 | Tragic 30.3% |