Native Hawaiian vs Venezuelan In Labor Force | Age 16-19
COMPARE
Native Hawaiian
Venezuelan
In Labor Force | Age 16-19
In Labor Force | Age 16-19 Comparison
Native Hawaiians
Venezuelans
37.4%
IN LABOR FORCE | AGE 16-19
85.0/ 100
METRIC RATING
149th/ 347
METRIC RANK
34.0%
IN LABOR FORCE | AGE 16-19
0.3/ 100
METRIC RATING
274th/ 347
METRIC RANK
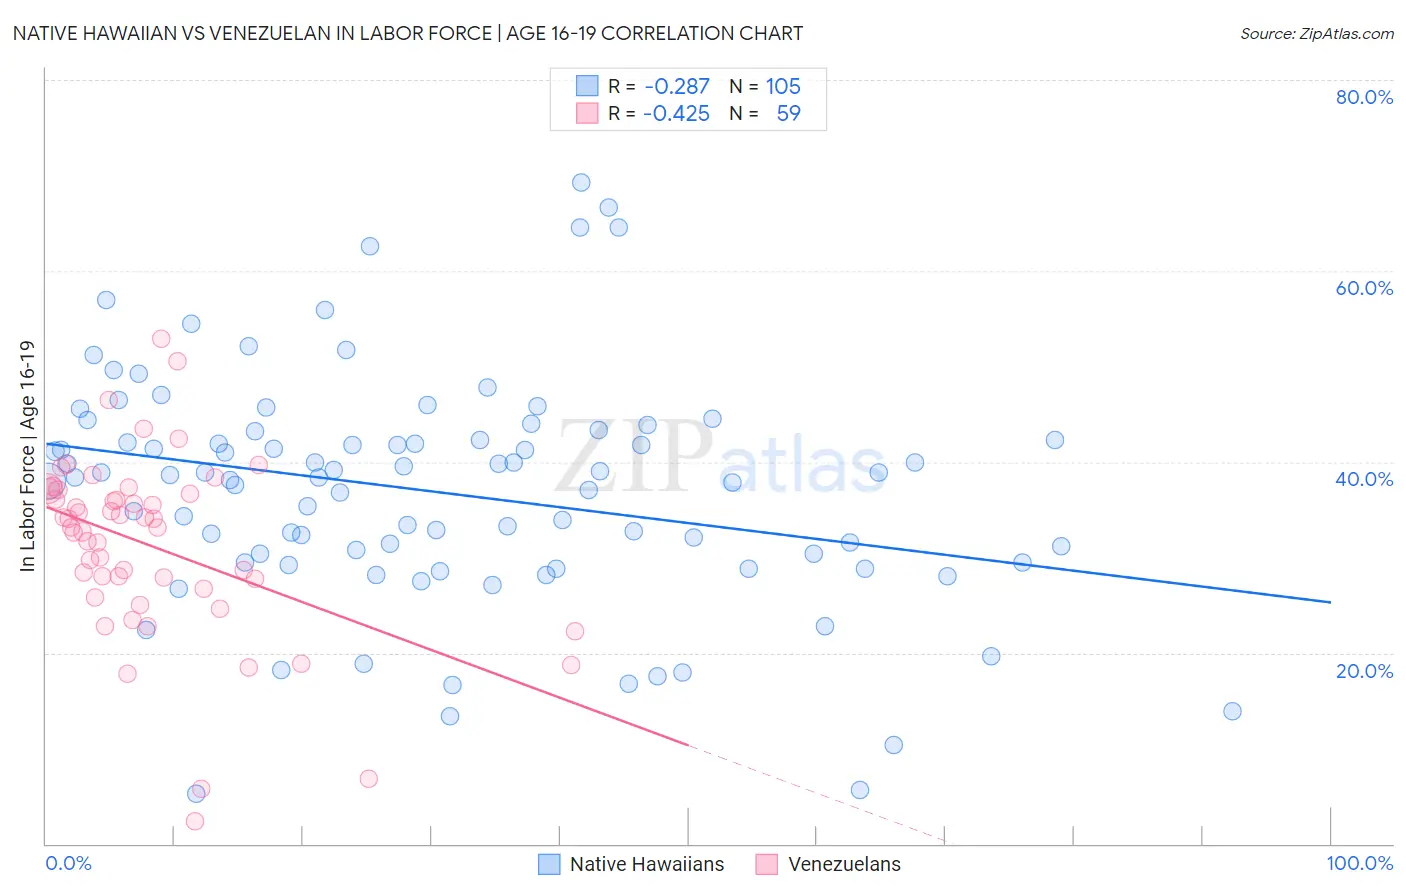
Native Hawaiian vs Venezuelan In Labor Force | Age 16-19 Correlation Chart
The statistical analysis conducted on geographies consisting of 331,673,637 people shows a weak negative correlation between the proportion of Native Hawaiians and labor force participation rate among population between the ages 16 and 19 in the United States with a correlation coefficient (R) of -0.287 and weighted average of 37.4%. Similarly, the statistical analysis conducted on geographies consisting of 306,036,928 people shows a moderate negative correlation between the proportion of Venezuelans and labor force participation rate among population between the ages 16 and 19 in the United States with a correlation coefficient (R) of -0.425 and weighted average of 34.0%, a difference of 10.0%.
In Labor Force | Age 16-19 Correlation Summary
| Measurement | Native Hawaiian | Venezuelan |
| Minimum | 5.3% | 2.4% |
| Maximum | 69.2% | 52.9% |
| Range | 63.9% | 50.5% |
| Mean | 36.8% | 31.2% |
| Median | 38.4% | 33.1% |
| Interquartile 25% (IQ1) | 29.4% | 26.7% |
| Interquartile 75% (IQ3) | 42.8% | 37.1% |
| Interquartile Range (IQR) | 13.3% | 10.4% |
| Standard Deviation (Sample) | 12.2% | 9.6% |
| Standard Deviation (Population) | 12.2% | 9.5% |
Similar Demographics by In Labor Force | Age 16-19
Demographics Similar to Native Hawaiians by In Labor Force | Age 16-19
In terms of in labor force | age 16-19, the demographic groups most similar to Native Hawaiians are Tsimshian (37.4%, a difference of 0.030%), Immigrants from Poland (37.3%, a difference of 0.050%), Immigrants from Sierra Leone (37.3%, a difference of 0.13%), Romanian (37.5%, a difference of 0.24%), and Arapaho (37.3%, a difference of 0.28%).
| Demographics | Rating | Rank | In Labor Force | Age 16-19 |
| Sierra Leoneans | 89.7 /100 | #142 | Excellent 37.6% |
| Pakistanis | 89.5 /100 | #143 | Excellent 37.6% |
| Japanese | 89.3 /100 | #144 | Excellent 37.5% |
| Paiute | 89.3 /100 | #145 | Excellent 37.5% |
| Immigrants | Western Europe | 88.9 /100 | #146 | Excellent 37.5% |
| Brazilians | 88.7 /100 | #147 | Excellent 37.5% |
| Romanians | 87.3 /100 | #148 | Excellent 37.5% |
| Native Hawaiians | 85.0 /100 | #149 | Excellent 37.4% |
| Tsimshian | 84.7 /100 | #150 | Excellent 37.4% |
| Immigrants | Poland | 84.4 /100 | #151 | Excellent 37.3% |
| Immigrants | Sierra Leone | 83.6 /100 | #152 | Excellent 37.3% |
| Arapaho | 81.8 /100 | #153 | Excellent 37.3% |
| Immigrants | Bulgaria | 81.6 /100 | #154 | Excellent 37.3% |
| Immigrants | Lithuania | 80.7 /100 | #155 | Excellent 37.2% |
| Kiowa | 80.4 /100 | #156 | Excellent 37.2% |
Demographics Similar to Venezuelans by In Labor Force | Age 16-19
In terms of in labor force | age 16-19, the demographic groups most similar to Venezuelans are Immigrants from Panama (34.0%, a difference of 0.090%), Immigrants from Fiji (33.9%, a difference of 0.090%), Immigrants from Latin America (33.9%, a difference of 0.20%), Asian (34.1%, a difference of 0.31%), and Menominee (33.9%, a difference of 0.31%).
| Demographics | Rating | Rank | In Labor Force | Age 16-19 |
| Immigrants | Peru | 0.5 /100 | #267 | Tragic 34.2% |
| Immigrants | Asia | 0.5 /100 | #268 | Tragic 34.1% |
| Pima | 0.5 /100 | #269 | Tragic 34.1% |
| Immigrants | Russia | 0.4 /100 | #270 | Tragic 34.1% |
| Central American Indians | 0.4 /100 | #271 | Tragic 34.1% |
| Asians | 0.4 /100 | #272 | Tragic 34.1% |
| Immigrants | Panama | 0.4 /100 | #273 | Tragic 34.0% |
| Venezuelans | 0.3 /100 | #274 | Tragic 34.0% |
| Immigrants | Fiji | 0.3 /100 | #275 | Tragic 33.9% |
| Immigrants | Latin America | 0.3 /100 | #276 | Tragic 33.9% |
| Menominee | 0.3 /100 | #277 | Tragic 33.9% |
| Colombians | 0.3 /100 | #278 | Tragic 33.8% |
| Paraguayans | 0.3 /100 | #279 | Tragic 33.8% |
| Taiwanese | 0.3 /100 | #280 | Tragic 33.8% |
| Cypriots | 0.3 /100 | #281 | Tragic 33.8% |