Albanian vs Nicaraguan In Labor Force | Age 16-19
COMPARE
Albanian
Nicaraguan
In Labor Force | Age 16-19
In Labor Force | Age 16-19 Comparison
Albanians
Nicaraguans
36.5%
IN LABOR FORCE | AGE 16-19
48.8/ 100
METRIC RATING
176th/ 347
METRIC RANK
32.4%
IN LABOR FORCE | AGE 16-19
0.0/ 100
METRIC RATING
305th/ 347
METRIC RANK
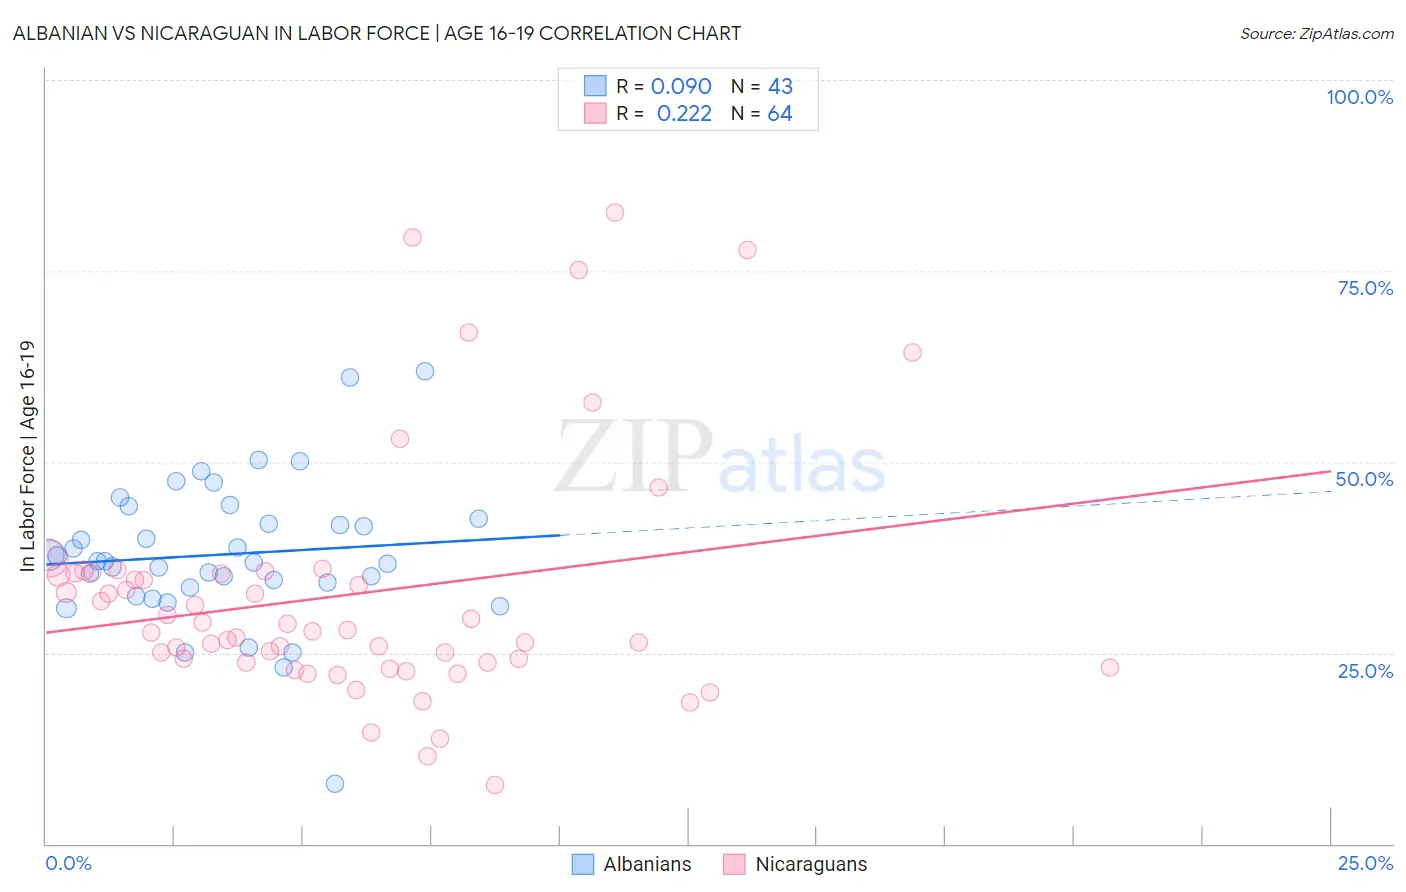
Albanian vs Nicaraguan In Labor Force | Age 16-19 Correlation Chart
The statistical analysis conducted on geographies consisting of 193,105,340 people shows a slight positive correlation between the proportion of Albanians and labor force participation rate among population between the ages 16 and 19 in the United States with a correlation coefficient (R) of 0.090 and weighted average of 36.5%. Similarly, the statistical analysis conducted on geographies consisting of 285,526,863 people shows a weak positive correlation between the proportion of Nicaraguans and labor force participation rate among population between the ages 16 and 19 in the United States with a correlation coefficient (R) of 0.222 and weighted average of 32.4%, a difference of 12.8%.
In Labor Force | Age 16-19 Correlation Summary
| Measurement | Albanian | Nicaraguan |
| Minimum | 7.8% | 7.7% |
| Maximum | 61.9% | 82.6% |
| Range | 54.1% | 74.9% |
| Mean | 37.9% | 32.6% |
| Median | 37.0% | 27.9% |
| Interquartile 25% (IQ1) | 33.5% | 23.7% |
| Interquartile 75% (IQ3) | 42.5% | 35.4% |
| Interquartile Range (IQR) | 9.0% | 11.7% |
| Standard Deviation (Sample) | 9.5% | 16.0% |
| Standard Deviation (Population) | 9.4% | 15.9% |
Similar Demographics by In Labor Force | Age 16-19
Demographics Similar to Albanians by In Labor Force | Age 16-19
In terms of in labor force | age 16-19, the demographic groups most similar to Albanians are Native/Alaskan (36.6%, a difference of 0.010%), Immigrants from Czechoslovakia (36.6%, a difference of 0.060%), Immigrants from Northern Europe (36.5%, a difference of 0.11%), Black/African American (36.5%, a difference of 0.19%), and Immigrants from Southern Europe (36.4%, a difference of 0.28%).
| Demographics | Rating | Rank | In Labor Force | Age 16-19 |
| Immigrants | Latvia | 61.6 /100 | #169 | Good 36.8% |
| Immigrants | South Africa | 60.5 /100 | #170 | Good 36.8% |
| Immigrants | Cambodia | 58.4 /100 | #171 | Average 36.7% |
| South Africans | 58.3 /100 | #172 | Average 36.7% |
| Russians | 57.5 /100 | #173 | Average 36.7% |
| Immigrants | Czechoslovakia | 50.0 /100 | #174 | Average 36.6% |
| Natives/Alaskans | 49.0 /100 | #175 | Average 36.6% |
| Albanians | 48.8 /100 | #176 | Average 36.5% |
| Immigrants | Northern Europe | 46.6 /100 | #177 | Average 36.5% |
| Blacks/African Americans | 45.1 /100 | #178 | Average 36.5% |
| Immigrants | Southern Europe | 43.3 /100 | #179 | Average 36.4% |
| Immigrants | Morocco | 41.1 /100 | #180 | Average 36.4% |
| Jordanians | 39.6 /100 | #181 | Fair 36.4% |
| Immigrants | Italy | 39.1 /100 | #182 | Fair 36.4% |
| Eastern Europeans | 38.8 /100 | #183 | Fair 36.4% |
Demographics Similar to Nicaraguans by In Labor Force | Age 16-19
In terms of in labor force | age 16-19, the demographic groups most similar to Nicaraguans are Israeli (32.4%, a difference of 0.050%), Spanish American Indian (32.4%, a difference of 0.13%), Immigrants from Dominica (32.5%, a difference of 0.24%), Immigrants from Jamaica (32.2%, a difference of 0.62%), and Navajo (32.1%, a difference of 0.97%).
| Demographics | Rating | Rank | In Labor Force | Age 16-19 |
| Iranians | 0.0 /100 | #298 | Tragic 33.0% |
| Armenians | 0.0 /100 | #299 | Tragic 32.9% |
| Immigrants | Argentina | 0.0 /100 | #300 | Tragic 32.9% |
| Okinawans | 0.0 /100 | #301 | Tragic 32.8% |
| Belizeans | 0.0 /100 | #302 | Tragic 32.8% |
| Immigrants | Dominica | 0.0 /100 | #303 | Tragic 32.5% |
| Israelis | 0.0 /100 | #304 | Tragic 32.4% |
| Nicaraguans | 0.0 /100 | #305 | Tragic 32.4% |
| Spanish American Indians | 0.0 /100 | #306 | Tragic 32.4% |
| Immigrants | Jamaica | 0.0 /100 | #307 | Tragic 32.2% |
| Navajo | 0.0 /100 | #308 | Tragic 32.1% |
| Immigrants | Eastern Asia | 0.0 /100 | #309 | Tragic 32.0% |
| Immigrants | Iran | 0.0 /100 | #310 | Tragic 32.0% |
| Indians (Asian) | 0.0 /100 | #311 | Tragic 31.9% |
| Immigrants | Belize | 0.0 /100 | #312 | Tragic 31.8% |