Immigrants from Belgium vs Nicaraguan In Labor Force | Age 16-19
COMPARE
Immigrants from Belgium
Nicaraguan
In Labor Force | Age 16-19
In Labor Force | Age 16-19 Comparison
Immigrants from Belgium
Nicaraguans
35.3%
IN LABOR FORCE | AGE 16-19
6.1/ 100
METRIC RATING
225th/ 347
METRIC RANK
32.4%
IN LABOR FORCE | AGE 16-19
0.0/ 100
METRIC RATING
305th/ 347
METRIC RANK
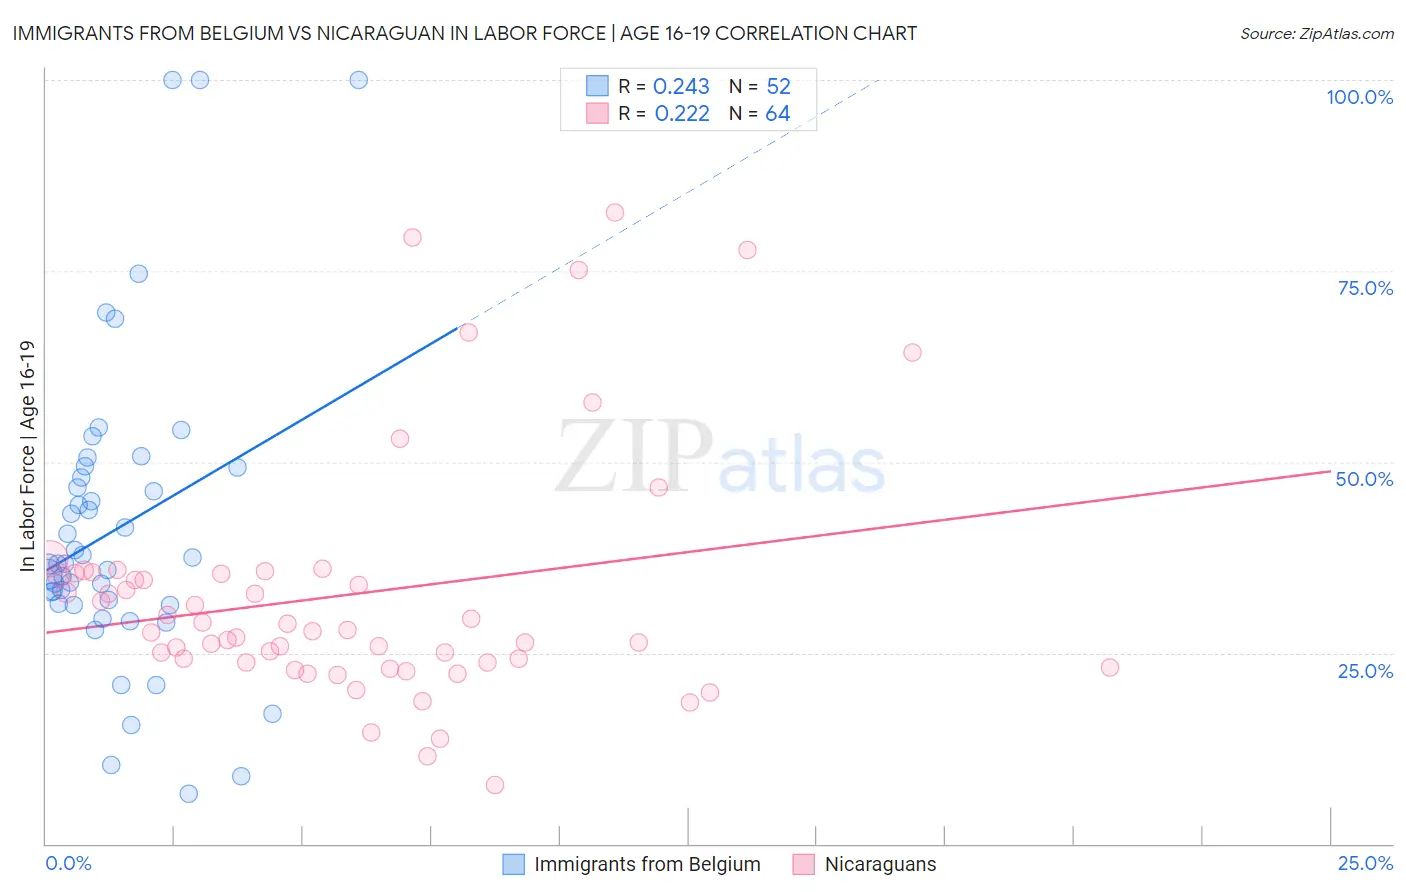
Immigrants from Belgium vs Nicaraguan In Labor Force | Age 16-19 Correlation Chart
The statistical analysis conducted on geographies consisting of 146,618,217 people shows a weak positive correlation between the proportion of Immigrants from Belgium and labor force participation rate among population between the ages 16 and 19 in the United States with a correlation coefficient (R) of 0.243 and weighted average of 35.3%. Similarly, the statistical analysis conducted on geographies consisting of 285,526,863 people shows a weak positive correlation between the proportion of Nicaraguans and labor force participation rate among population between the ages 16 and 19 in the United States with a correlation coefficient (R) of 0.222 and weighted average of 32.4%, a difference of 9.0%.
In Labor Force | Age 16-19 Correlation Summary
| Measurement | Immigrants from Belgium | Nicaraguan |
| Minimum | 6.6% | 7.7% |
| Maximum | 100.0% | 82.6% |
| Range | 93.4% | 74.9% |
| Mean | 41.3% | 32.6% |
| Median | 36.7% | 27.9% |
| Interquartile 25% (IQ1) | 31.4% | 23.7% |
| Interquartile 75% (IQ3) | 48.6% | 35.4% |
| Interquartile Range (IQR) | 17.2% | 11.7% |
| Standard Deviation (Sample) | 20.2% | 16.0% |
| Standard Deviation (Population) | 20.0% | 15.9% |
Similar Demographics by In Labor Force | Age 16-19
Demographics Similar to Immigrants from Belgium by In Labor Force | Age 16-19
In terms of in labor force | age 16-19, the demographic groups most similar to Immigrants from Belgium are Honduran (35.3%, a difference of 0.080%), Ghanaian (35.3%, a difference of 0.090%), Immigrants from Guatemala (35.3%, a difference of 0.090%), Mongolian (35.3%, a difference of 0.10%), and Immigrants from Senegal (35.3%, a difference of 0.15%).
| Demographics | Rating | Rank | In Labor Force | Age 16-19 |
| Sri Lankans | 9.8 /100 | #218 | Tragic 35.5% |
| Guatemalans | 8.6 /100 | #219 | Tragic 35.5% |
| Immigrants | Bahamas | 8.3 /100 | #220 | Tragic 35.5% |
| Turks | 7.3 /100 | #221 | Tragic 35.4% |
| Immigrants | Ghana | 7.3 /100 | #222 | Tragic 35.4% |
| Ghanaians | 6.5 /100 | #223 | Tragic 35.3% |
| Hondurans | 6.5 /100 | #224 | Tragic 35.3% |
| Immigrants | Belgium | 6.1 /100 | #225 | Tragic 35.3% |
| Immigrants | Guatemala | 5.7 /100 | #226 | Tragic 35.3% |
| Mongolians | 5.7 /100 | #227 | Tragic 35.3% |
| Immigrants | Senegal | 5.5 /100 | #228 | Tragic 35.3% |
| Immigrants | Lebanon | 5.0 /100 | #229 | Tragic 35.2% |
| Immigrants | Honduras | 4.9 /100 | #230 | Tragic 35.2% |
| Immigrants | Syria | 4.5 /100 | #231 | Tragic 35.2% |
| Immigrants | Kazakhstan | 4.5 /100 | #232 | Tragic 35.2% |
Demographics Similar to Nicaraguans by In Labor Force | Age 16-19
In terms of in labor force | age 16-19, the demographic groups most similar to Nicaraguans are Israeli (32.4%, a difference of 0.050%), Spanish American Indian (32.4%, a difference of 0.13%), Immigrants from Dominica (32.5%, a difference of 0.24%), Immigrants from Jamaica (32.2%, a difference of 0.62%), and Navajo (32.1%, a difference of 0.97%).
| Demographics | Rating | Rank | In Labor Force | Age 16-19 |
| Iranians | 0.0 /100 | #298 | Tragic 33.0% |
| Armenians | 0.0 /100 | #299 | Tragic 32.9% |
| Immigrants | Argentina | 0.0 /100 | #300 | Tragic 32.9% |
| Okinawans | 0.0 /100 | #301 | Tragic 32.8% |
| Belizeans | 0.0 /100 | #302 | Tragic 32.8% |
| Immigrants | Dominica | 0.0 /100 | #303 | Tragic 32.5% |
| Israelis | 0.0 /100 | #304 | Tragic 32.4% |
| Nicaraguans | 0.0 /100 | #305 | Tragic 32.4% |
| Spanish American Indians | 0.0 /100 | #306 | Tragic 32.4% |
| Immigrants | Jamaica | 0.0 /100 | #307 | Tragic 32.2% |
| Navajo | 0.0 /100 | #308 | Tragic 32.1% |
| Immigrants | Eastern Asia | 0.0 /100 | #309 | Tragic 32.0% |
| Immigrants | Iran | 0.0 /100 | #310 | Tragic 32.0% |
| Indians (Asian) | 0.0 /100 | #311 | Tragic 31.9% |
| Immigrants | Belize | 0.0 /100 | #312 | Tragic 31.8% |