Chickasaw vs Immigrants from Japan In Labor Force | Age 30-34
COMPARE
Chickasaw
Immigrants from Japan
In Labor Force | Age 30-34
In Labor Force | Age 30-34 Comparison
Chickasaw
Immigrants from Japan
81.9%
IN LABOR FORCE | AGE 30-34
0.0/ 100
METRIC RATING
311th/ 347
METRIC RANK
85.4%
IN LABOR FORCE | AGE 30-34
99.1/ 100
METRIC RATING
71st/ 347
METRIC RANK
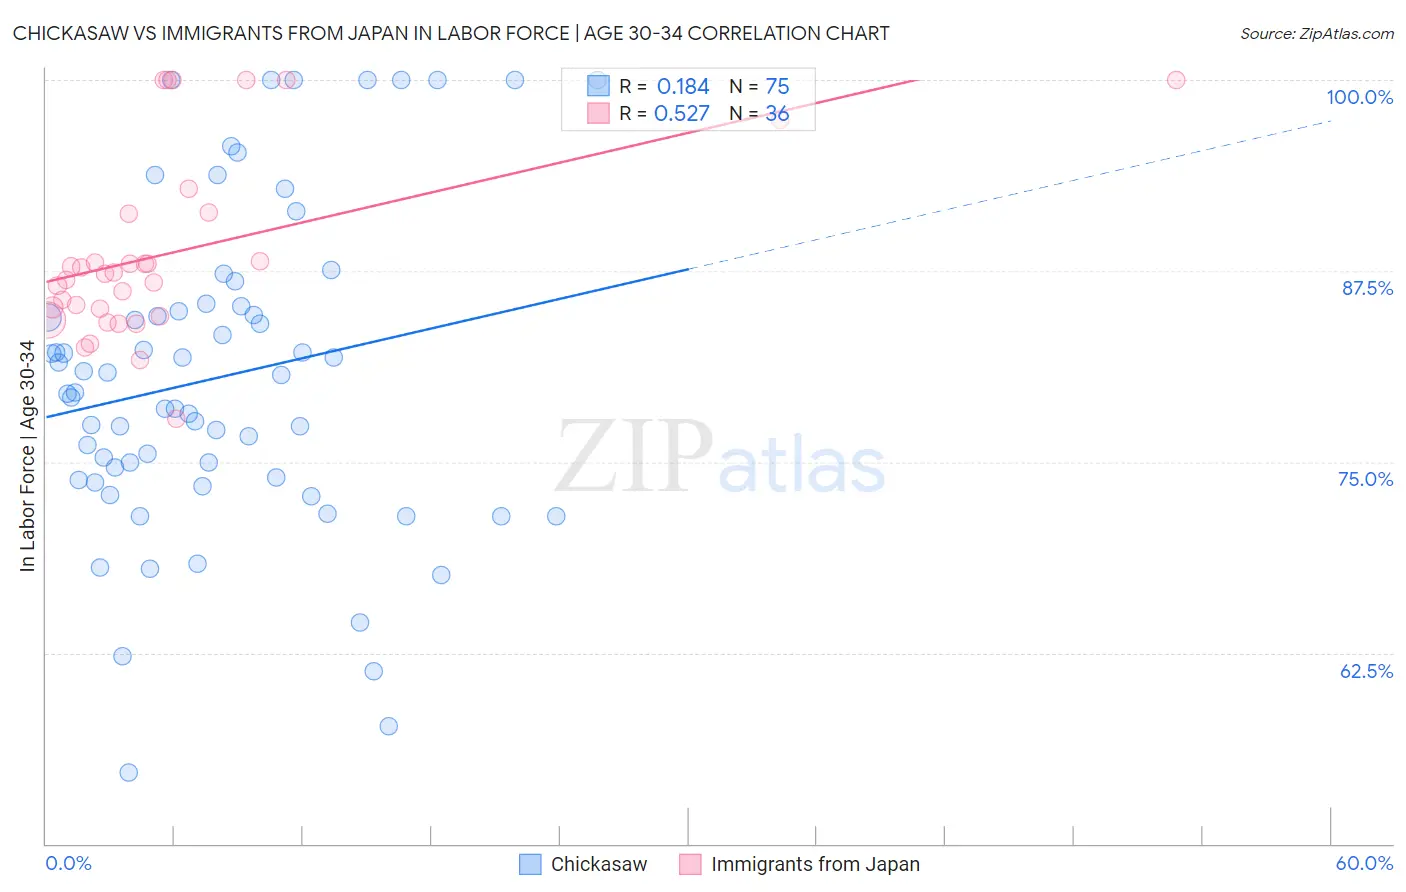
Chickasaw vs Immigrants from Japan In Labor Force | Age 30-34 Correlation Chart
The statistical analysis conducted on geographies consisting of 147,694,826 people shows a poor positive correlation between the proportion of Chickasaw and labor force participation rate among population between the ages 30 and 34 in the United States with a correlation coefficient (R) of 0.184 and weighted average of 81.9%. Similarly, the statistical analysis conducted on geographies consisting of 340,023,870 people shows a substantial positive correlation between the proportion of Immigrants from Japan and labor force participation rate among population between the ages 30 and 34 in the United States with a correlation coefficient (R) of 0.527 and weighted average of 85.4%, a difference of 4.2%.
In Labor Force | Age 30-34 Correlation Summary
| Measurement | Chickasaw | Immigrants from Japan |
| Minimum | 54.6% | 77.8% |
| Maximum | 100.0% | 100.0% |
| Range | 45.4% | 22.2% |
| Mean | 80.6% | 88.8% |
| Median | 79.6% | 87.4% |
| Interquartile 25% (IQ1) | 73.8% | 84.7% |
| Interquartile 75% (IQ3) | 85.2% | 91.3% |
| Interquartile Range (IQR) | 11.4% | 6.6% |
| Standard Deviation (Sample) | 10.5% | 6.1% |
| Standard Deviation (Population) | 10.4% | 6.0% |
Similar Demographics by In Labor Force | Age 30-34
Demographics Similar to Chickasaw by In Labor Force | Age 30-34
In terms of in labor force | age 30-34, the demographic groups most similar to Chickasaw are Mexican (81.9%, a difference of 0.0%), Iroquois (81.9%, a difference of 0.020%), Cajun (82.0%, a difference of 0.050%), Immigrants from Mexico (82.0%, a difference of 0.070%), and Puget Sound Salish (82.1%, a difference of 0.24%).
| Demographics | Rating | Rank | In Labor Force | Age 30-34 |
| Tlingit-Haida | 0.0 /100 | #304 | Tragic 82.3% |
| Osage | 0.0 /100 | #305 | Tragic 82.3% |
| Spanish American Indians | 0.0 /100 | #306 | Tragic 82.2% |
| Menominee | 0.0 /100 | #307 | Tragic 82.2% |
| Puget Sound Salish | 0.0 /100 | #308 | Tragic 82.1% |
| Immigrants | Mexico | 0.0 /100 | #309 | Tragic 82.0% |
| Cajuns | 0.0 /100 | #310 | Tragic 82.0% |
| Chickasaw | 0.0 /100 | #311 | Tragic 81.9% |
| Mexicans | 0.0 /100 | #312 | Tragic 81.9% |
| Iroquois | 0.0 /100 | #313 | Tragic 81.9% |
| Alaskan Athabascans | 0.0 /100 | #314 | Tragic 81.7% |
| Cherokee | 0.0 /100 | #315 | Tragic 81.6% |
| Immigrants | Azores | 0.0 /100 | #316 | Tragic 81.5% |
| Arapaho | 0.0 /100 | #317 | Tragic 81.5% |
| Choctaw | 0.0 /100 | #318 | Tragic 81.4% |
Demographics Similar to Immigrants from Japan by In Labor Force | Age 30-34
In terms of in labor force | age 30-34, the demographic groups most similar to Immigrants from Japan are Brazilian (85.4%, a difference of 0.0%), Immigrants from China (85.4%, a difference of 0.0%), Indian (Asian) (85.4%, a difference of 0.010%), Maltese (85.4%, a difference of 0.010%), and Immigrants from Czechoslovakia (85.4%, a difference of 0.010%).
| Demographics | Rating | Rank | In Labor Force | Age 30-34 |
| Italians | 99.4 /100 | #64 | Exceptional 85.4% |
| Senegalese | 99.4 /100 | #65 | Exceptional 85.4% |
| Ghanaians | 99.4 /100 | #66 | Exceptional 85.4% |
| Kenyans | 99.3 /100 | #67 | Exceptional 85.4% |
| Immigrants | Eastern Europe | 99.3 /100 | #68 | Exceptional 85.4% |
| Immigrants | Iran | 99.2 /100 | #69 | Exceptional 85.4% |
| Brazilians | 99.1 /100 | #70 | Exceptional 85.4% |
| Immigrants | Japan | 99.1 /100 | #71 | Exceptional 85.4% |
| Immigrants | China | 99.0 /100 | #72 | Exceptional 85.4% |
| Indians (Asian) | 99.0 /100 | #73 | Exceptional 85.4% |
| Maltese | 99.0 /100 | #74 | Exceptional 85.4% |
| Immigrants | Czechoslovakia | 99.0 /100 | #75 | Exceptional 85.4% |
| Iranians | 99.0 /100 | #76 | Exceptional 85.4% |
| Immigrants | Eastern Asia | 98.9 /100 | #77 | Exceptional 85.4% |
| Immigrants | Singapore | 98.8 /100 | #78 | Exceptional 85.3% |