Immigrants from North Macedonia vs Cheyenne In Labor Force | Age 30-34
COMPARE
Immigrants from North Macedonia
Cheyenne
In Labor Force | Age 30-34
In Labor Force | Age 30-34 Comparison
Immigrants from North Macedonia
Cheyenne
85.9%
IN LABOR FORCE | AGE 30-34
100.0/ 100
METRIC RATING
25th/ 347
METRIC RANK
81.1%
IN LABOR FORCE | AGE 30-34
0.0/ 100
METRIC RATING
324th/ 347
METRIC RANK
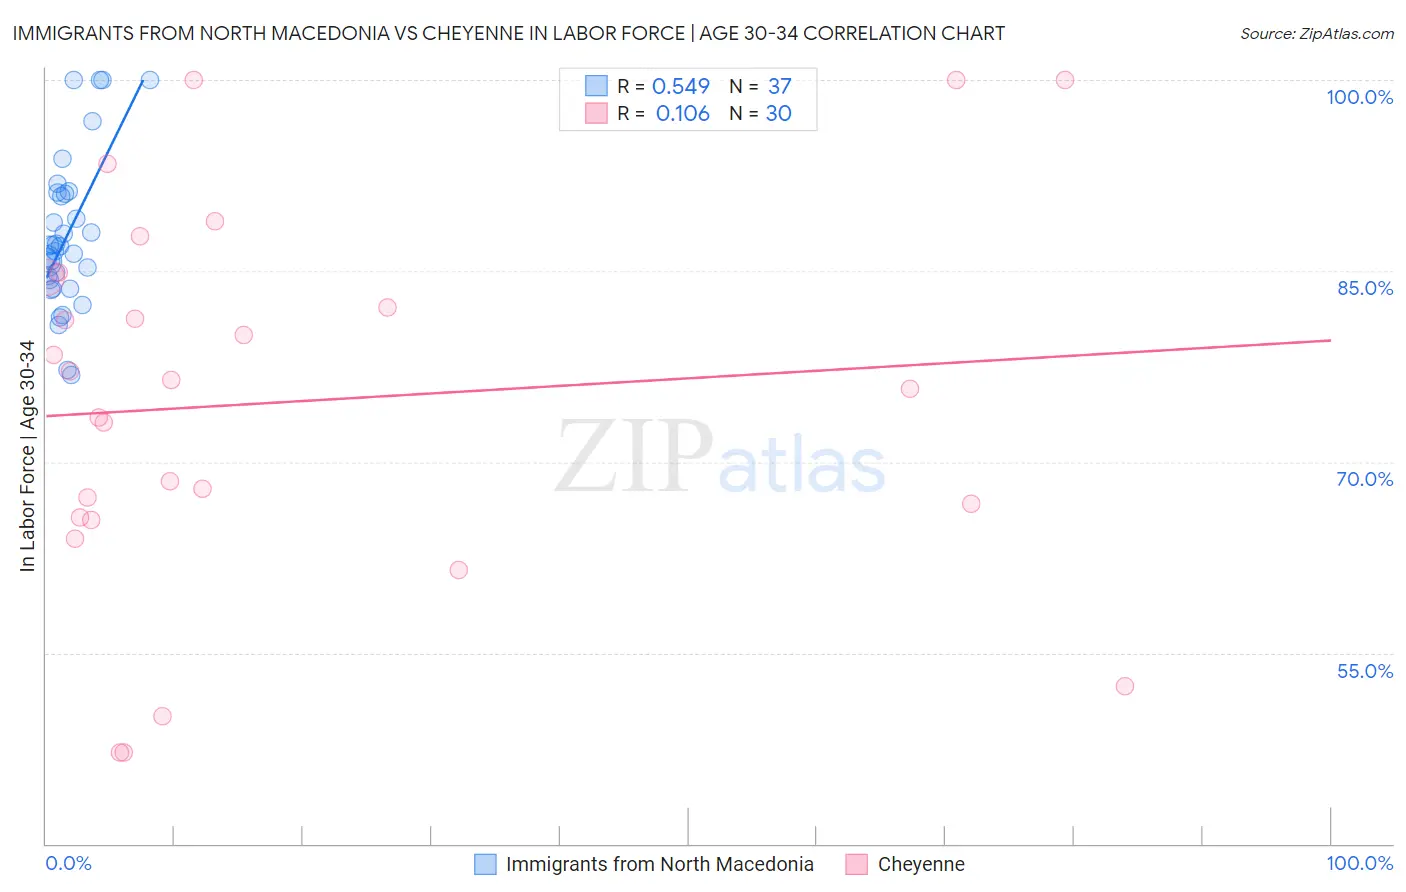
Immigrants from North Macedonia vs Cheyenne In Labor Force | Age 30-34 Correlation Chart
The statistical analysis conducted on geographies consisting of 74,312,807 people shows a substantial positive correlation between the proportion of Immigrants from North Macedonia and labor force participation rate among population between the ages 30 and 34 in the United States with a correlation coefficient (R) of 0.549 and weighted average of 85.9%. Similarly, the statistical analysis conducted on geographies consisting of 80,694,830 people shows a poor positive correlation between the proportion of Cheyenne and labor force participation rate among population between the ages 30 and 34 in the United States with a correlation coefficient (R) of 0.106 and weighted average of 81.1%, a difference of 5.9%.
In Labor Force | Age 30-34 Correlation Summary
| Measurement | Immigrants from North Macedonia | Cheyenne |
| Minimum | 76.8% | 47.1% |
| Maximum | 100.0% | 100.0% |
| Range | 23.2% | 52.9% |
| Mean | 87.8% | 74.7% |
| Median | 86.9% | 76.0% |
| Interquartile 25% (IQ1) | 83.9% | 65.6% |
| Interquartile 75% (IQ3) | 91.1% | 84.5% |
| Interquartile Range (IQR) | 7.2% | 18.9% |
| Standard Deviation (Sample) | 6.0% | 14.8% |
| Standard Deviation (Population) | 5.9% | 14.5% |
Similar Demographics by In Labor Force | Age 30-34
Demographics Similar to Immigrants from North Macedonia by In Labor Force | Age 30-34
In terms of in labor force | age 30-34, the demographic groups most similar to Immigrants from North Macedonia are Immigrants from Eritrea (85.9%, a difference of 0.010%), Immigrants from Eastern Africa (85.9%, a difference of 0.010%), Bermudan (85.9%, a difference of 0.020%), Estonian (85.9%, a difference of 0.020%), and Immigrants from Liberia (85.9%, a difference of 0.030%).
| Demographics | Rating | Rank | In Labor Force | Age 30-34 |
| Immigrants | Sierra Leone | 100.0 /100 | #18 | Exceptional 86.0% |
| Sierra Leoneans | 100.0 /100 | #19 | Exceptional 86.0% |
| Bulgarians | 100.0 /100 | #20 | Exceptional 86.0% |
| Immigrants | Bulgaria | 100.0 /100 | #21 | Exceptional 86.0% |
| Bermudans | 100.0 /100 | #22 | Exceptional 85.9% |
| Estonians | 100.0 /100 | #23 | Exceptional 85.9% |
| Immigrants | Eritrea | 100.0 /100 | #24 | Exceptional 85.9% |
| Immigrants | North Macedonia | 100.0 /100 | #25 | Exceptional 85.9% |
| Immigrants | Eastern Africa | 100.0 /100 | #26 | Exceptional 85.9% |
| Immigrants | Liberia | 100.0 /100 | #27 | Exceptional 85.9% |
| Immigrants | Latvia | 100.0 /100 | #28 | Exceptional 85.9% |
| Tsimshian | 100.0 /100 | #29 | Exceptional 85.8% |
| Immigrants | Hong Kong | 100.0 /100 | #30 | Exceptional 85.8% |
| Paraguayans | 99.9 /100 | #31 | Exceptional 85.8% |
| Cypriots | 99.9 /100 | #32 | Exceptional 85.8% |
Demographics Similar to Cheyenne by In Labor Force | Age 30-34
In terms of in labor force | age 30-34, the demographic groups most similar to Cheyenne are Paiute (81.2%, a difference of 0.030%), Puerto Rican (81.2%, a difference of 0.080%), Dutch West Indian (81.0%, a difference of 0.15%), Alaska Native (81.3%, a difference of 0.24%), and Yaqui (81.4%, a difference of 0.32%).
| Demographics | Rating | Rank | In Labor Force | Age 30-34 |
| Arapaho | 0.0 /100 | #317 | Tragic 81.5% |
| Choctaw | 0.0 /100 | #318 | Tragic 81.4% |
| Shoshone | 0.0 /100 | #319 | Tragic 81.4% |
| Yaqui | 0.0 /100 | #320 | Tragic 81.4% |
| Alaska Natives | 0.0 /100 | #321 | Tragic 81.3% |
| Puerto Ricans | 0.0 /100 | #322 | Tragic 81.2% |
| Paiute | 0.0 /100 | #323 | Tragic 81.2% |
| Cheyenne | 0.0 /100 | #324 | Tragic 81.1% |
| Dutch West Indians | 0.0 /100 | #325 | Tragic 81.0% |
| Seminole | 0.0 /100 | #326 | Tragic 80.8% |
| Colville | 0.0 /100 | #327 | Tragic 80.7% |
| Sioux | 0.0 /100 | #328 | Tragic 80.4% |
| Creek | 0.0 /100 | #329 | Tragic 80.4% |
| Pueblo | 0.0 /100 | #330 | Tragic 80.0% |
| Houma | 0.0 /100 | #331 | Tragic 79.9% |