Mexican vs Arab In Labor Force | Age 25-29
COMPARE
Mexican
Arab
In Labor Force | Age 25-29
In Labor Force | Age 25-29 Comparison
Mexicans
Arabs
81.9%
IN LABOR FORCE | AGE 25-29
0.0/ 100
METRIC RATING
316th/ 347
METRIC RANK
84.2%
IN LABOR FORCE | AGE 25-29
6.8/ 100
METRIC RATING
221st/ 347
METRIC RANK
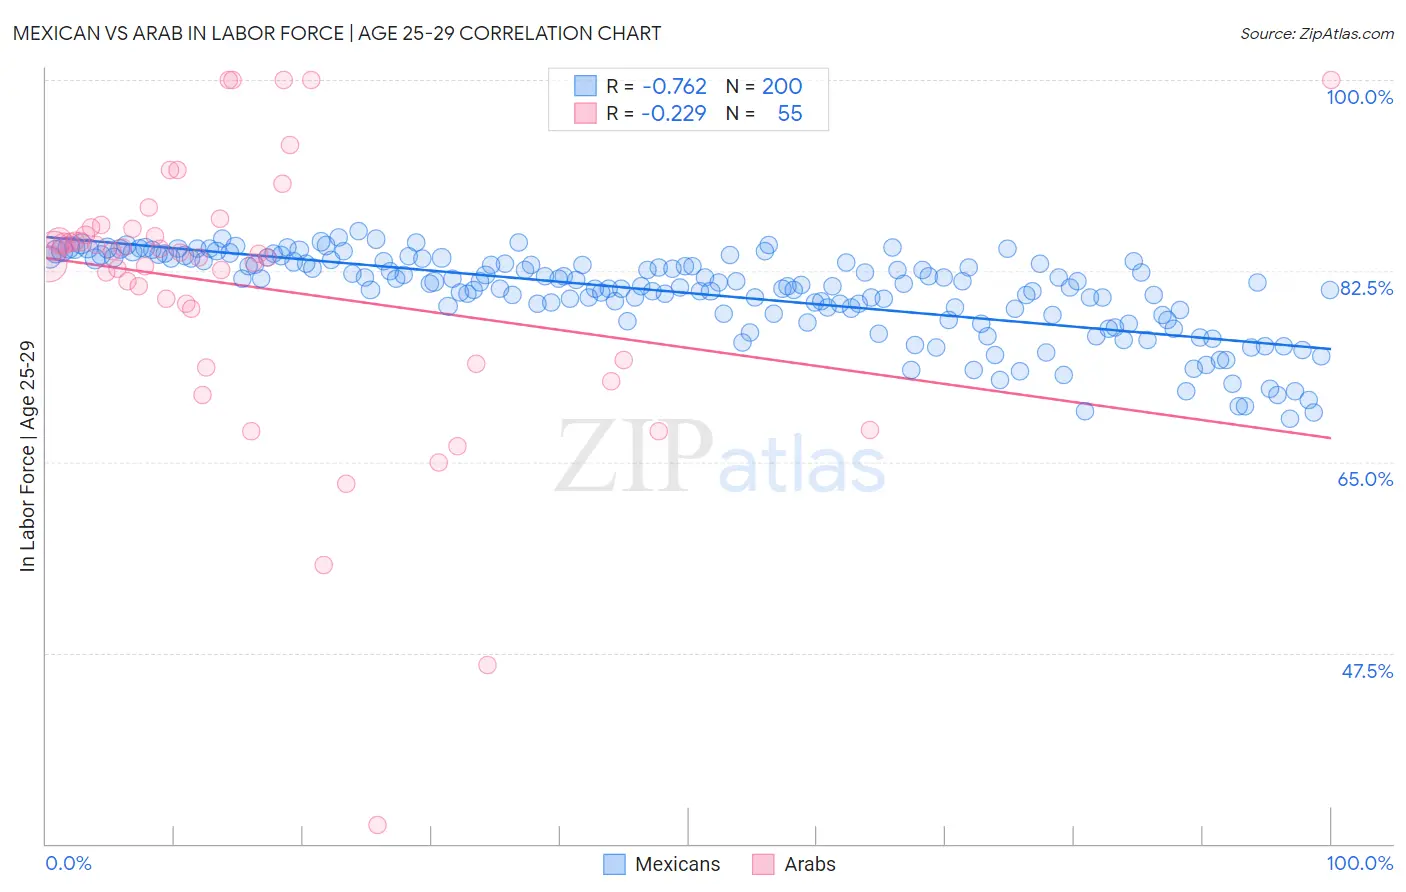
Mexican vs Arab In Labor Force | Age 25-29 Correlation Chart
The statistical analysis conducted on geographies consisting of 564,184,194 people shows a strong negative correlation between the proportion of Mexicans and labor force participation rate among population between the ages 25 and 29 in the United States with a correlation coefficient (R) of -0.762 and weighted average of 81.9%. Similarly, the statistical analysis conducted on geographies consisting of 486,557,270 people shows a weak negative correlation between the proportion of Arabs and labor force participation rate among population between the ages 25 and 29 in the United States with a correlation coefficient (R) of -0.229 and weighted average of 84.2%, a difference of 2.8%.
In Labor Force | Age 25-29 Correlation Summary
| Measurement | Mexican | Arab |
| Minimum | 69.0% | 31.7% |
| Maximum | 86.2% | 100.0% |
| Range | 17.2% | 68.3% |
| Mean | 80.5% | 81.0% |
| Median | 81.4% | 84.1% |
| Interquartile 25% (IQ1) | 78.6% | 74.3% |
| Interquartile 75% (IQ3) | 83.5% | 86.4% |
| Interquartile Range (IQR) | 4.9% | 12.1% |
| Standard Deviation (Sample) | 3.9% | 12.7% |
| Standard Deviation (Population) | 3.9% | 12.5% |
Similar Demographics by In Labor Force | Age 25-29
Demographics Similar to Mexicans by In Labor Force | Age 25-29
In terms of in labor force | age 25-29, the demographic groups most similar to Mexicans are Chickasaw (81.9%, a difference of 0.070%), Immigrants from Mexico (82.0%, a difference of 0.090%), Comanche (81.9%, a difference of 0.090%), Cherokee (82.1%, a difference of 0.22%), and Yaqui (82.2%, a difference of 0.27%).
| Demographics | Rating | Rank | In Labor Force | Age 25-29 |
| Immigrants | Central America | 0.0 /100 | #309 | Tragic 82.4% |
| Osage | 0.0 /100 | #310 | Tragic 82.3% |
| Alaskan Athabascans | 0.0 /100 | #311 | Tragic 82.3% |
| Hispanics or Latinos | 0.0 /100 | #312 | Tragic 82.2% |
| Yaqui | 0.0 /100 | #313 | Tragic 82.2% |
| Cherokee | 0.0 /100 | #314 | Tragic 82.1% |
| Immigrants | Mexico | 0.0 /100 | #315 | Tragic 82.0% |
| Mexicans | 0.0 /100 | #316 | Tragic 81.9% |
| Chickasaw | 0.0 /100 | #317 | Tragic 81.9% |
| Comanche | 0.0 /100 | #318 | Tragic 81.9% |
| Seminole | 0.0 /100 | #319 | Tragic 81.7% |
| Colville | 0.0 /100 | #320 | Tragic 81.6% |
| Shoshone | 0.0 /100 | #321 | Tragic 81.6% |
| Kiowa | 0.0 /100 | #322 | Tragic 81.6% |
| Alaska Natives | 0.0 /100 | #323 | Tragic 81.6% |
Demographics Similar to Arabs by In Labor Force | Age 25-29
In terms of in labor force | age 25-29, the demographic groups most similar to Arabs are Jordanian (84.2%, a difference of 0.0%), Nigerian (84.3%, a difference of 0.010%), Scotch-Irish (84.2%, a difference of 0.010%), Immigrants from West Indies (84.2%, a difference of 0.020%), and Korean (84.2%, a difference of 0.030%).
| Demographics | Rating | Rank | In Labor Force | Age 25-29 |
| Lebanese | 11.1 /100 | #214 | Poor 84.3% |
| Immigrants | Syria | 10.7 /100 | #215 | Poor 84.3% |
| Israelis | 9.3 /100 | #216 | Tragic 84.3% |
| Immigrants | Ecuador | 9.3 /100 | #217 | Tragic 84.3% |
| Immigrants | Nigeria | 9.0 /100 | #218 | Tragic 84.3% |
| Immigrants | Saudi Arabia | 8.8 /100 | #219 | Tragic 84.3% |
| Nigerians | 7.2 /100 | #220 | Tragic 84.3% |
| Arabs | 6.8 /100 | #221 | Tragic 84.2% |
| Jordanians | 6.7 /100 | #222 | Tragic 84.2% |
| Scotch-Irish | 6.5 /100 | #223 | Tragic 84.2% |
| Immigrants | West Indies | 6.0 /100 | #224 | Tragic 84.2% |
| Koreans | 5.9 /100 | #225 | Tragic 84.2% |
| Immigrants | Congo | 5.8 /100 | #226 | Tragic 84.2% |
| French American Indians | 5.5 /100 | #227 | Tragic 84.2% |
| Immigrants | Panama | 5.5 /100 | #228 | Tragic 84.2% |