Jamaican vs Arab In Labor Force | Age 25-29
COMPARE
Jamaican
Arab
In Labor Force | Age 25-29
In Labor Force | Age 25-29 Comparison
Jamaicans
Arabs
83.9%
IN LABOR FORCE | AGE 25-29
0.8/ 100
METRIC RATING
239th/ 347
METRIC RANK
84.2%
IN LABOR FORCE | AGE 25-29
6.8/ 100
METRIC RATING
221st/ 347
METRIC RANK
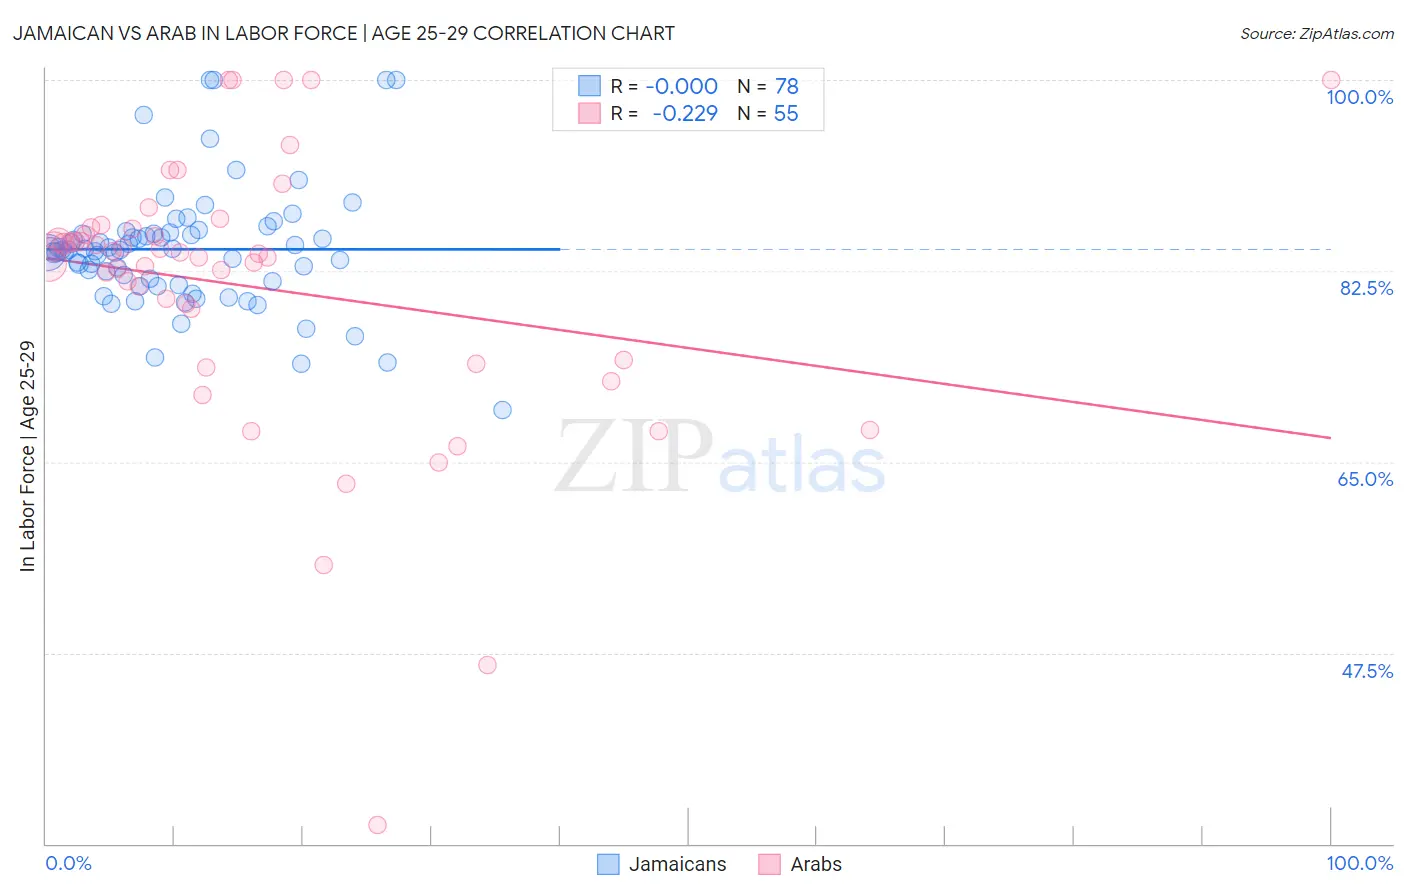
Jamaican vs Arab In Labor Force | Age 25-29 Correlation Chart
The statistical analysis conducted on geographies consisting of 367,887,997 people shows no correlation between the proportion of Jamaicans and labor force participation rate among population between the ages 25 and 29 in the United States with a correlation coefficient (R) of -0.000 and weighted average of 83.9%. Similarly, the statistical analysis conducted on geographies consisting of 486,557,270 people shows a weak negative correlation between the proportion of Arabs and labor force participation rate among population between the ages 25 and 29 in the United States with a correlation coefficient (R) of -0.229 and weighted average of 84.2%, a difference of 0.42%.
In Labor Force | Age 25-29 Correlation Summary
| Measurement | Jamaican | Arab |
| Minimum | 69.7% | 31.7% |
| Maximum | 100.0% | 100.0% |
| Range | 30.3% | 68.3% |
| Mean | 84.5% | 81.0% |
| Median | 84.4% | 84.1% |
| Interquartile 25% (IQ1) | 81.6% | 74.3% |
| Interquartile 75% (IQ3) | 86.0% | 86.4% |
| Interquartile Range (IQR) | 4.4% | 12.1% |
| Standard Deviation (Sample) | 5.6% | 12.7% |
| Standard Deviation (Population) | 5.5% | 12.5% |
Demographics Similar to Jamaicans and Arabs by In Labor Force | Age 25-29
In terms of in labor force | age 25-29, the demographic groups most similar to Jamaicans are Immigrants from Uzbekistan (83.9%, a difference of 0.0%), Trinidadian and Tobagonian (83.9%, a difference of 0.0%), Immigrants (83.9%, a difference of 0.030%), Iraqi (83.9%, a difference of 0.040%), and Guamanian/Chamorro (83.9%, a difference of 0.040%). Similarly, the demographic groups most similar to Arabs are Jordanian (84.2%, a difference of 0.0%), Nigerian (84.3%, a difference of 0.010%), Scotch-Irish (84.2%, a difference of 0.010%), Immigrants from West Indies (84.2%, a difference of 0.020%), and Korean (84.2%, a difference of 0.030%).
| Demographics | Rating | Rank | In Labor Force | Age 25-29 |
| Nigerians | 7.2 /100 | #220 | Tragic 84.3% |
| Arabs | 6.8 /100 | #221 | Tragic 84.2% |
| Jordanians | 6.7 /100 | #222 | Tragic 84.2% |
| Scotch-Irish | 6.5 /100 | #223 | Tragic 84.2% |
| Immigrants | West Indies | 6.0 /100 | #224 | Tragic 84.2% |
| Koreans | 5.9 /100 | #225 | Tragic 84.2% |
| Immigrants | Congo | 5.8 /100 | #226 | Tragic 84.2% |
| French American Indians | 5.5 /100 | #227 | Tragic 84.2% |
| Immigrants | Panama | 5.5 /100 | #228 | Tragic 84.2% |
| Immigrants | Oceania | 5.0 /100 | #229 | Tragic 84.2% |
| Whites/Caucasians | 4.8 /100 | #230 | Tragic 84.2% |
| Immigrants | Philippines | 4.7 /100 | #231 | Tragic 84.2% |
| Panamanians | 4.5 /100 | #232 | Tragic 84.2% |
| Immigrants | Western Asia | 2.7 /100 | #233 | Tragic 84.1% |
| Barbadians | 1.0 /100 | #234 | Tragic 83.9% |
| Iraqis | 0.9 /100 | #235 | Tragic 83.9% |
| Guamanians/Chamorros | 0.9 /100 | #236 | Tragic 83.9% |
| Immigrants | Immigrants | 0.9 /100 | #237 | Tragic 83.9% |
| Immigrants | Uzbekistan | 0.8 /100 | #238 | Tragic 83.9% |
| Jamaicans | 0.8 /100 | #239 | Tragic 83.9% |
| Trinidadians and Tobagonians | 0.7 /100 | #240 | Tragic 83.9% |