Mexican vs Immigrants from Sierra Leone In Labor Force | Age 25-29
COMPARE
Mexican
Immigrants from Sierra Leone
In Labor Force | Age 25-29
In Labor Force | Age 25-29 Comparison
Mexicans
Immigrants from Sierra Leone
81.9%
IN LABOR FORCE | AGE 25-29
0.0/ 100
METRIC RATING
316th/ 347
METRIC RANK
85.7%
IN LABOR FORCE | AGE 25-29
99.9/ 100
METRIC RATING
45th/ 347
METRIC RANK
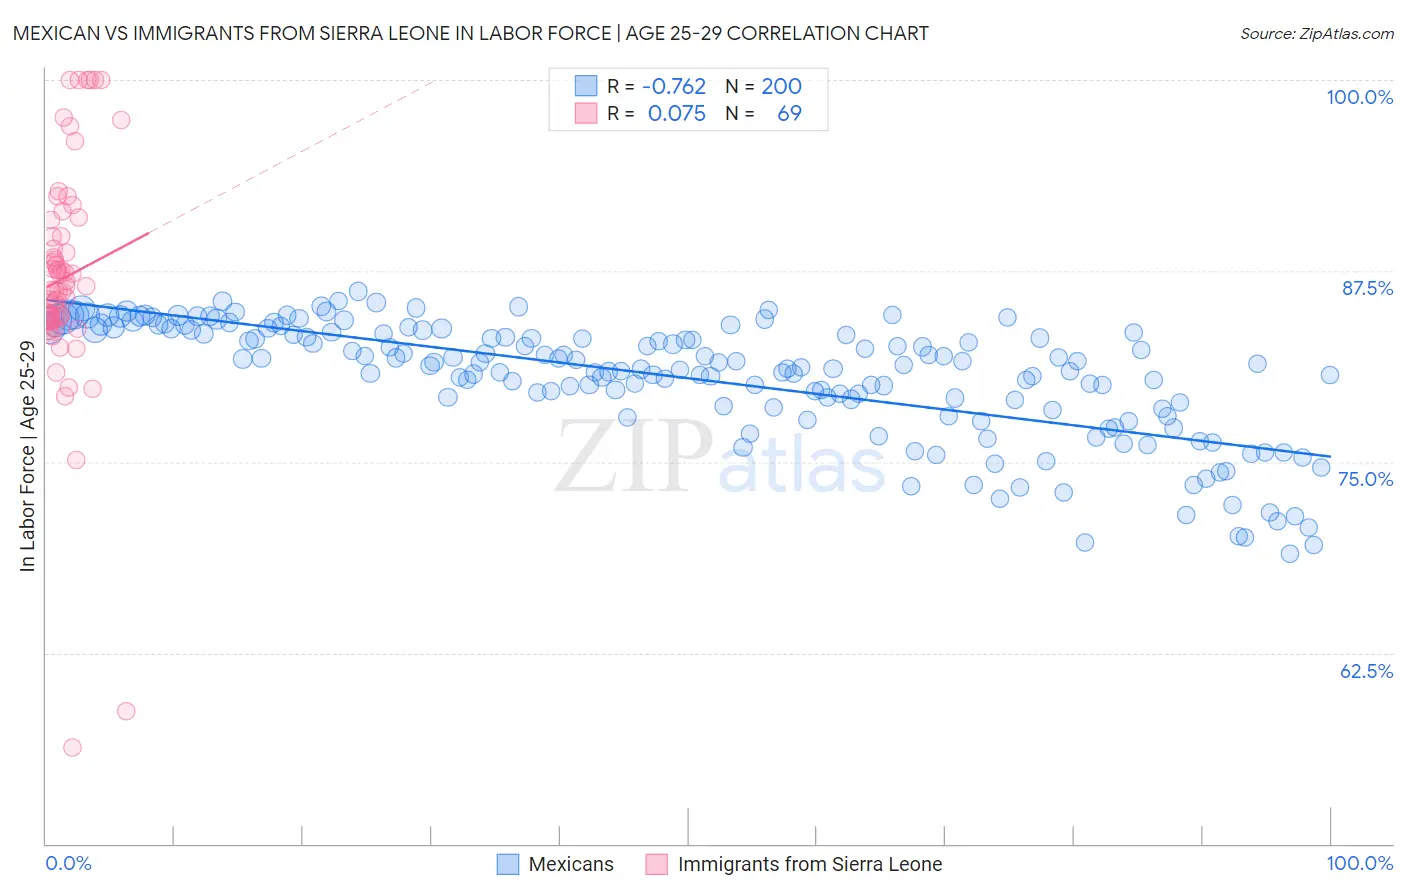
Mexican vs Immigrants from Sierra Leone In Labor Force | Age 25-29 Correlation Chart
The statistical analysis conducted on geographies consisting of 564,184,194 people shows a strong negative correlation between the proportion of Mexicans and labor force participation rate among population between the ages 25 and 29 in the United States with a correlation coefficient (R) of -0.762 and weighted average of 81.9%. Similarly, the statistical analysis conducted on geographies consisting of 101,649,226 people shows a slight positive correlation between the proportion of Immigrants from Sierra Leone and labor force participation rate among population between the ages 25 and 29 in the United States with a correlation coefficient (R) of 0.075 and weighted average of 85.7%, a difference of 4.6%.
In Labor Force | Age 25-29 Correlation Summary
| Measurement | Mexican | Immigrants from Sierra Leone |
| Minimum | 69.0% | 56.3% |
| Maximum | 86.2% | 100.0% |
| Range | 17.2% | 43.7% |
| Mean | 80.5% | 87.1% |
| Median | 81.4% | 86.5% |
| Interquartile 25% (IQ1) | 78.6% | 84.4% |
| Interquartile 75% (IQ3) | 83.5% | 90.3% |
| Interquartile Range (IQR) | 4.9% | 6.0% |
| Standard Deviation (Sample) | 3.9% | 7.6% |
| Standard Deviation (Population) | 3.9% | 7.5% |
Similar Demographics by In Labor Force | Age 25-29
Demographics Similar to Mexicans by In Labor Force | Age 25-29
In terms of in labor force | age 25-29, the demographic groups most similar to Mexicans are Chickasaw (81.9%, a difference of 0.070%), Immigrants from Mexico (82.0%, a difference of 0.090%), Comanche (81.9%, a difference of 0.090%), Cherokee (82.1%, a difference of 0.22%), and Yaqui (82.2%, a difference of 0.27%).
| Demographics | Rating | Rank | In Labor Force | Age 25-29 |
| Immigrants | Central America | 0.0 /100 | #309 | Tragic 82.4% |
| Osage | 0.0 /100 | #310 | Tragic 82.3% |
| Alaskan Athabascans | 0.0 /100 | #311 | Tragic 82.3% |
| Hispanics or Latinos | 0.0 /100 | #312 | Tragic 82.2% |
| Yaqui | 0.0 /100 | #313 | Tragic 82.2% |
| Cherokee | 0.0 /100 | #314 | Tragic 82.1% |
| Immigrants | Mexico | 0.0 /100 | #315 | Tragic 82.0% |
| Mexicans | 0.0 /100 | #316 | Tragic 81.9% |
| Chickasaw | 0.0 /100 | #317 | Tragic 81.9% |
| Comanche | 0.0 /100 | #318 | Tragic 81.9% |
| Seminole | 0.0 /100 | #319 | Tragic 81.7% |
| Colville | 0.0 /100 | #320 | Tragic 81.6% |
| Shoshone | 0.0 /100 | #321 | Tragic 81.6% |
| Kiowa | 0.0 /100 | #322 | Tragic 81.6% |
| Alaska Natives | 0.0 /100 | #323 | Tragic 81.6% |
Demographics Similar to Immigrants from Sierra Leone by In Labor Force | Age 25-29
In terms of in labor force | age 25-29, the demographic groups most similar to Immigrants from Sierra Leone are Macedonian (85.7%, a difference of 0.0%), Immigrants from India (85.7%, a difference of 0.010%), Immigrants from Eritrea (85.7%, a difference of 0.020%), Czech (85.6%, a difference of 0.030%), and Immigrants from Greece (85.7%, a difference of 0.060%).
| Demographics | Rating | Rank | In Labor Force | Age 25-29 |
| Sierra Leoneans | 99.9 /100 | #38 | Exceptional 85.8% |
| Croatians | 99.9 /100 | #39 | Exceptional 85.8% |
| Immigrants | Albania | 99.9 /100 | #40 | Exceptional 85.7% |
| Immigrants | Greece | 99.9 /100 | #41 | Exceptional 85.7% |
| Immigrants | Eritrea | 99.9 /100 | #42 | Exceptional 85.7% |
| Immigrants | India | 99.9 /100 | #43 | Exceptional 85.7% |
| Macedonians | 99.9 /100 | #44 | Exceptional 85.7% |
| Immigrants | Sierra Leone | 99.9 /100 | #45 | Exceptional 85.7% |
| Czechs | 99.8 /100 | #46 | Exceptional 85.6% |
| Turks | 99.8 /100 | #47 | Exceptional 85.6% |
| Italians | 99.8 /100 | #48 | Exceptional 85.6% |
| Swedes | 99.8 /100 | #49 | Exceptional 85.6% |
| Yugoslavians | 99.8 /100 | #50 | Exceptional 85.6% |
| Immigrants | Latvia | 99.8 /100 | #51 | Exceptional 85.6% |
| Immigrants | Poland | 99.7 /100 | #52 | Exceptional 85.6% |