Mexican vs Samoan In Labor Force | Age 25-29
COMPARE
Mexican
Samoan
In Labor Force | Age 25-29
In Labor Force | Age 25-29 Comparison
Mexicans
Samoans
81.9%
IN LABOR FORCE | AGE 25-29
0.0/ 100
METRIC RATING
316th/ 347
METRIC RANK
83.3%
IN LABOR FORCE | AGE 25-29
0.0/ 100
METRIC RATING
275th/ 347
METRIC RANK
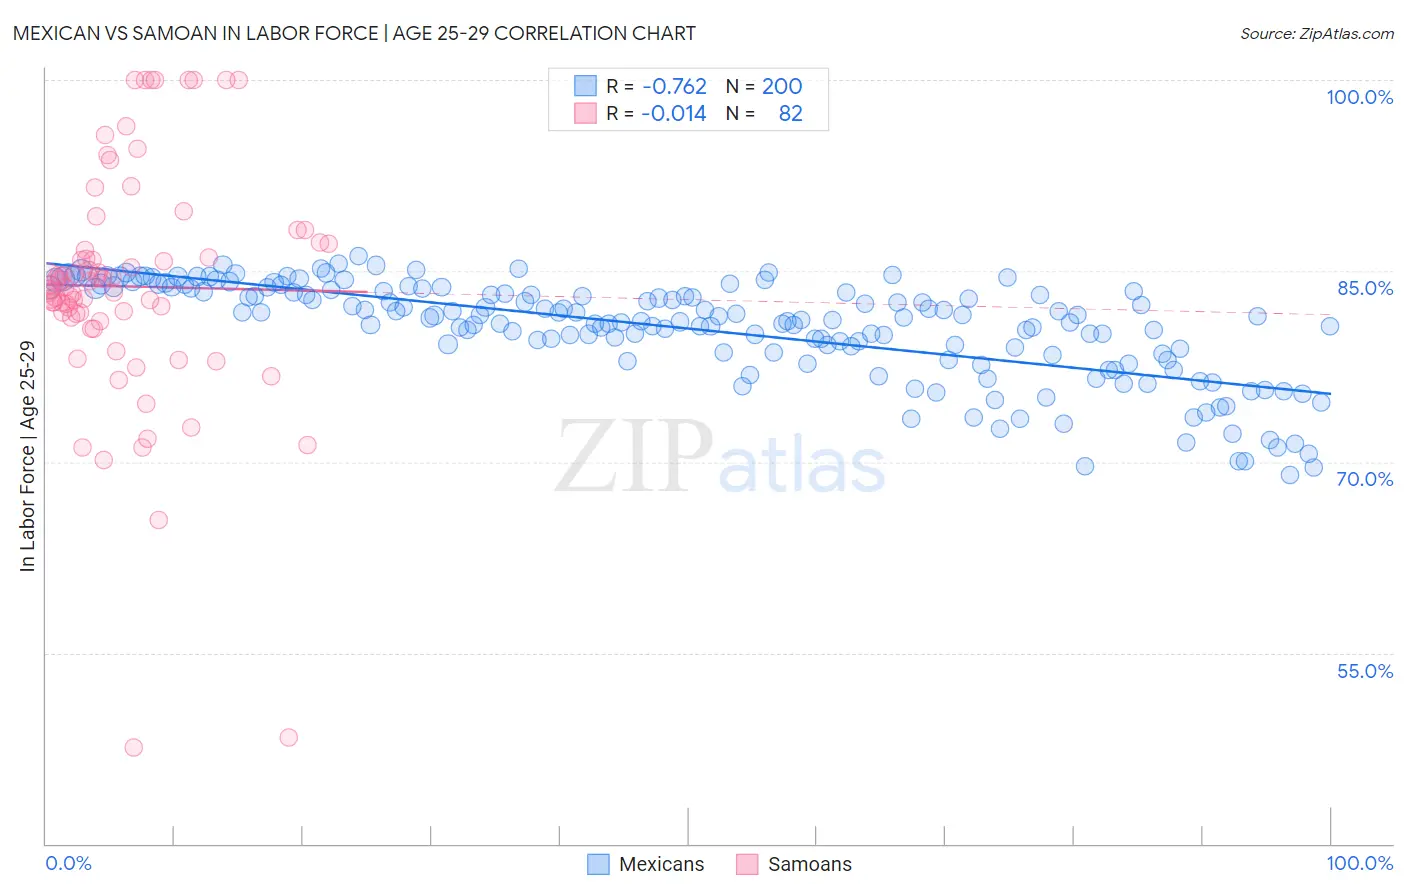
Mexican vs Samoan In Labor Force | Age 25-29 Correlation Chart
The statistical analysis conducted on geographies consisting of 564,184,194 people shows a strong negative correlation between the proportion of Mexicans and labor force participation rate among population between the ages 25 and 29 in the United States with a correlation coefficient (R) of -0.762 and weighted average of 81.9%. Similarly, the statistical analysis conducted on geographies consisting of 225,148,243 people shows no correlation between the proportion of Samoans and labor force participation rate among population between the ages 25 and 29 in the United States with a correlation coefficient (R) of -0.014 and weighted average of 83.3%, a difference of 1.7%.
In Labor Force | Age 25-29 Correlation Summary
| Measurement | Mexican | Samoan |
| Minimum | 69.0% | 47.6% |
| Maximum | 86.2% | 100.0% |
| Range | 17.2% | 52.4% |
| Mean | 80.5% | 83.8% |
| Median | 81.4% | 83.8% |
| Interquartile 25% (IQ1) | 78.6% | 81.3% |
| Interquartile 75% (IQ3) | 83.5% | 87.1% |
| Interquartile Range (IQR) | 4.9% | 5.8% |
| Standard Deviation (Sample) | 3.9% | 9.5% |
| Standard Deviation (Population) | 3.9% | 9.4% |
Similar Demographics by In Labor Force | Age 25-29
Demographics Similar to Mexicans by In Labor Force | Age 25-29
In terms of in labor force | age 25-29, the demographic groups most similar to Mexicans are Chickasaw (81.9%, a difference of 0.070%), Immigrants from Mexico (82.0%, a difference of 0.090%), Comanche (81.9%, a difference of 0.090%), Cherokee (82.1%, a difference of 0.22%), and Yaqui (82.2%, a difference of 0.27%).
| Demographics | Rating | Rank | In Labor Force | Age 25-29 |
| Immigrants | Central America | 0.0 /100 | #309 | Tragic 82.4% |
| Osage | 0.0 /100 | #310 | Tragic 82.3% |
| Alaskan Athabascans | 0.0 /100 | #311 | Tragic 82.3% |
| Hispanics or Latinos | 0.0 /100 | #312 | Tragic 82.2% |
| Yaqui | 0.0 /100 | #313 | Tragic 82.2% |
| Cherokee | 0.0 /100 | #314 | Tragic 82.1% |
| Immigrants | Mexico | 0.0 /100 | #315 | Tragic 82.0% |
| Mexicans | 0.0 /100 | #316 | Tragic 81.9% |
| Chickasaw | 0.0 /100 | #317 | Tragic 81.9% |
| Comanche | 0.0 /100 | #318 | Tragic 81.9% |
| Seminole | 0.0 /100 | #319 | Tragic 81.7% |
| Colville | 0.0 /100 | #320 | Tragic 81.6% |
| Shoshone | 0.0 /100 | #321 | Tragic 81.6% |
| Kiowa | 0.0 /100 | #322 | Tragic 81.6% |
| Alaska Natives | 0.0 /100 | #323 | Tragic 81.6% |
Demographics Similar to Samoans by In Labor Force | Age 25-29
In terms of in labor force | age 25-29, the demographic groups most similar to Samoans are Immigrants from Honduras (83.3%, a difference of 0.0%), Marshallese (83.3%, a difference of 0.050%), Immigrants from Caribbean (83.4%, a difference of 0.070%), Immigrants from Dominica (83.4%, a difference of 0.070%), and African (83.2%, a difference of 0.070%).
| Demographics | Rating | Rank | In Labor Force | Age 25-29 |
| Immigrants | Lebanon | 0.0 /100 | #268 | Tragic 83.4% |
| Immigrants | Barbados | 0.0 /100 | #269 | Tragic 83.4% |
| Basques | 0.0 /100 | #270 | Tragic 83.4% |
| Hondurans | 0.0 /100 | #271 | Tragic 83.4% |
| Immigrants | Caribbean | 0.0 /100 | #272 | Tragic 83.4% |
| Immigrants | Dominica | 0.0 /100 | #273 | Tragic 83.4% |
| Marshallese | 0.0 /100 | #274 | Tragic 83.3% |
| Samoans | 0.0 /100 | #275 | Tragic 83.3% |
| Immigrants | Honduras | 0.0 /100 | #276 | Tragic 83.3% |
| Africans | 0.0 /100 | #277 | Tragic 83.2% |
| Immigrants | Cuba | 0.0 /100 | #278 | Tragic 83.2% |
| British West Indians | 0.0 /100 | #279 | Tragic 83.2% |
| Dominicans | 0.0 /100 | #280 | Tragic 83.2% |
| Immigrants | Dominican Republic | 0.0 /100 | #281 | Tragic 83.1% |
| Americans | 0.0 /100 | #282 | Tragic 83.1% |