Mexican vs Fijian In Labor Force | Age 25-29
COMPARE
Mexican
Fijian
In Labor Force | Age 25-29
In Labor Force | Age 25-29 Comparison
Mexicans
Fijians
81.9%
IN LABOR FORCE | AGE 25-29
0.0/ 100
METRIC RATING
316th/ 347
METRIC RANK
82.9%
IN LABOR FORCE | AGE 25-29
0.0/ 100
METRIC RATING
299th/ 347
METRIC RANK
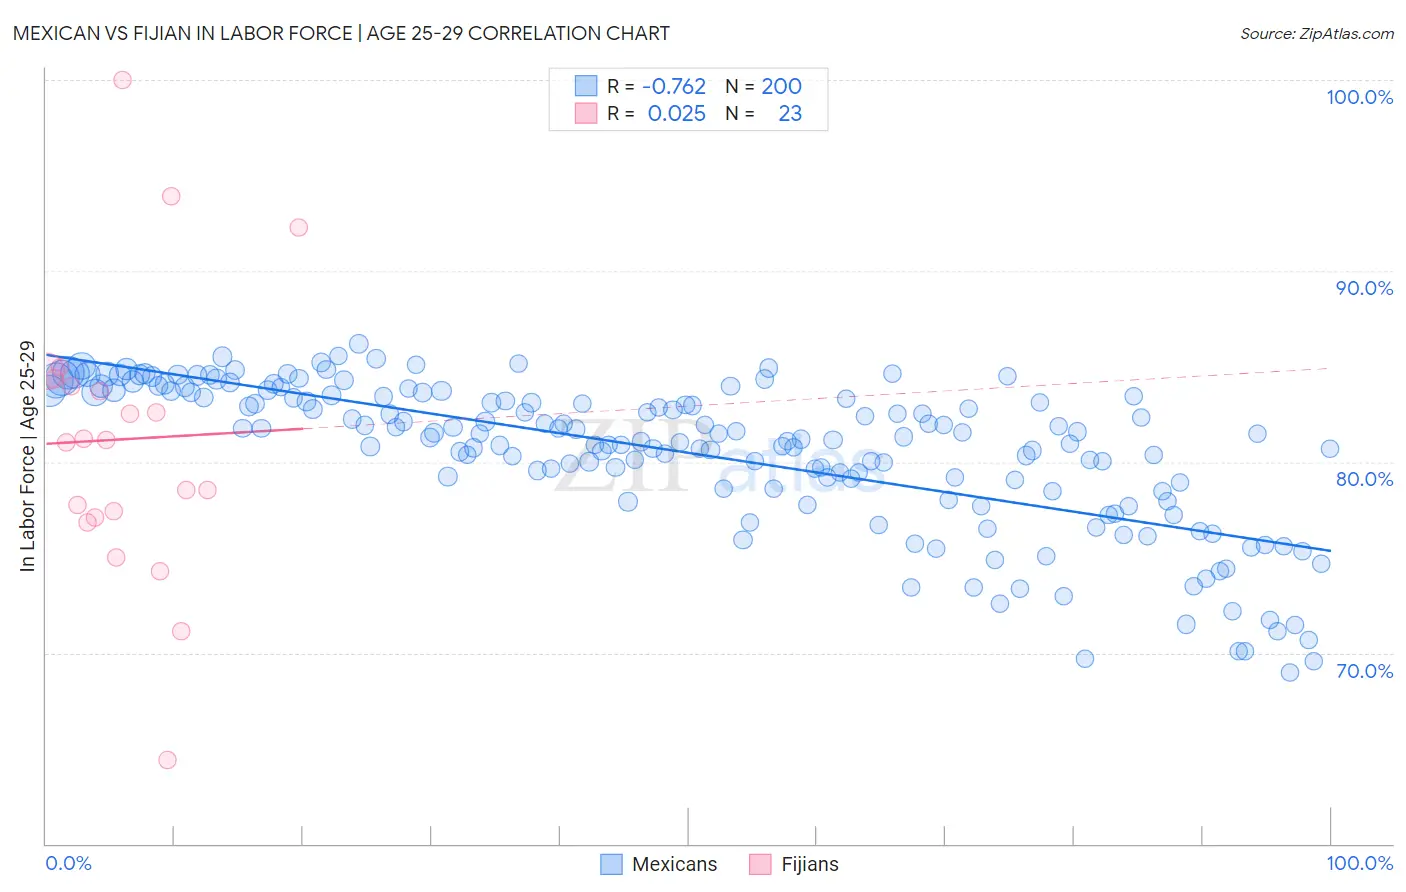
Mexican vs Fijian In Labor Force | Age 25-29 Correlation Chart
The statistical analysis conducted on geographies consisting of 564,184,194 people shows a strong negative correlation between the proportion of Mexicans and labor force participation rate among population between the ages 25 and 29 in the United States with a correlation coefficient (R) of -0.762 and weighted average of 81.9%. Similarly, the statistical analysis conducted on geographies consisting of 55,945,515 people shows no correlation between the proportion of Fijians and labor force participation rate among population between the ages 25 and 29 in the United States with a correlation coefficient (R) of 0.025 and weighted average of 82.9%, a difference of 1.2%.
In Labor Force | Age 25-29 Correlation Summary
| Measurement | Mexican | Fijian |
| Minimum | 69.0% | 64.4% |
| Maximum | 86.2% | 100.0% |
| Range | 17.2% | 35.6% |
| Mean | 80.5% | 81.2% |
| Median | 81.4% | 81.2% |
| Interquartile 25% (IQ1) | 78.6% | 77.1% |
| Interquartile 75% (IQ3) | 83.5% | 84.3% |
| Interquartile Range (IQR) | 4.9% | 7.3% |
| Standard Deviation (Sample) | 3.9% | 7.5% |
| Standard Deviation (Population) | 3.9% | 7.3% |
Demographics Similar to Mexicans and Fijians by In Labor Force | Age 25-29
In terms of in labor force | age 25-29, the demographic groups most similar to Mexicans are Chickasaw (81.9%, a difference of 0.070%), Immigrants from Mexico (82.0%, a difference of 0.090%), Cherokee (82.1%, a difference of 0.22%), Yaqui (82.2%, a difference of 0.27%), and Hispanic or Latino (82.2%, a difference of 0.36%). Similarly, the demographic groups most similar to Fijians are Native Hawaiian (82.9%, a difference of 0.010%), Spanish American Indian (82.9%, a difference of 0.010%), Potawatomi (82.9%, a difference of 0.030%), Vietnamese (82.8%, a difference of 0.080%), and Immigrants from Belize (82.8%, a difference of 0.11%).
| Demographics | Rating | Rank | In Labor Force | Age 25-29 |
| Potawatomi | 0.0 /100 | #297 | Tragic 82.9% |
| Native Hawaiians | 0.0 /100 | #298 | Tragic 82.9% |
| Fijians | 0.0 /100 | #299 | Tragic 82.9% |
| Spanish American Indians | 0.0 /100 | #300 | Tragic 82.9% |
| Vietnamese | 0.0 /100 | #301 | Tragic 82.8% |
| Immigrants | Belize | 0.0 /100 | #302 | Tragic 82.8% |
| Immigrants | Grenada | 0.0 /100 | #303 | Tragic 82.8% |
| Immigrants | St. Vincent and the Grenadines | 0.0 /100 | #304 | Tragic 82.7% |
| Blacks/African Americans | 0.0 /100 | #305 | Tragic 82.6% |
| Blackfeet | 0.0 /100 | #306 | Tragic 82.6% |
| Cajuns | 0.0 /100 | #307 | Tragic 82.5% |
| Central American Indians | 0.0 /100 | #308 | Tragic 82.4% |
| Immigrants | Central America | 0.0 /100 | #309 | Tragic 82.4% |
| Osage | 0.0 /100 | #310 | Tragic 82.3% |
| Alaskan Athabascans | 0.0 /100 | #311 | Tragic 82.3% |
| Hispanics or Latinos | 0.0 /100 | #312 | Tragic 82.2% |
| Yaqui | 0.0 /100 | #313 | Tragic 82.2% |
| Cherokee | 0.0 /100 | #314 | Tragic 82.1% |
| Immigrants | Mexico | 0.0 /100 | #315 | Tragic 82.0% |
| Mexicans | 0.0 /100 | #316 | Tragic 81.9% |
| Chickasaw | 0.0 /100 | #317 | Tragic 81.9% |