Mexican vs Scandinavian In Labor Force | Age 25-29
COMPARE
Mexican
Scandinavian
In Labor Force | Age 25-29
In Labor Force | Age 25-29 Comparison
Mexicans
Scandinavians
81.9%
IN LABOR FORCE | AGE 25-29
0.0/ 100
METRIC RATING
316th/ 347
METRIC RANK
84.9%
IN LABOR FORCE | AGE 25-29
85.1/ 100
METRIC RATING
122nd/ 347
METRIC RANK
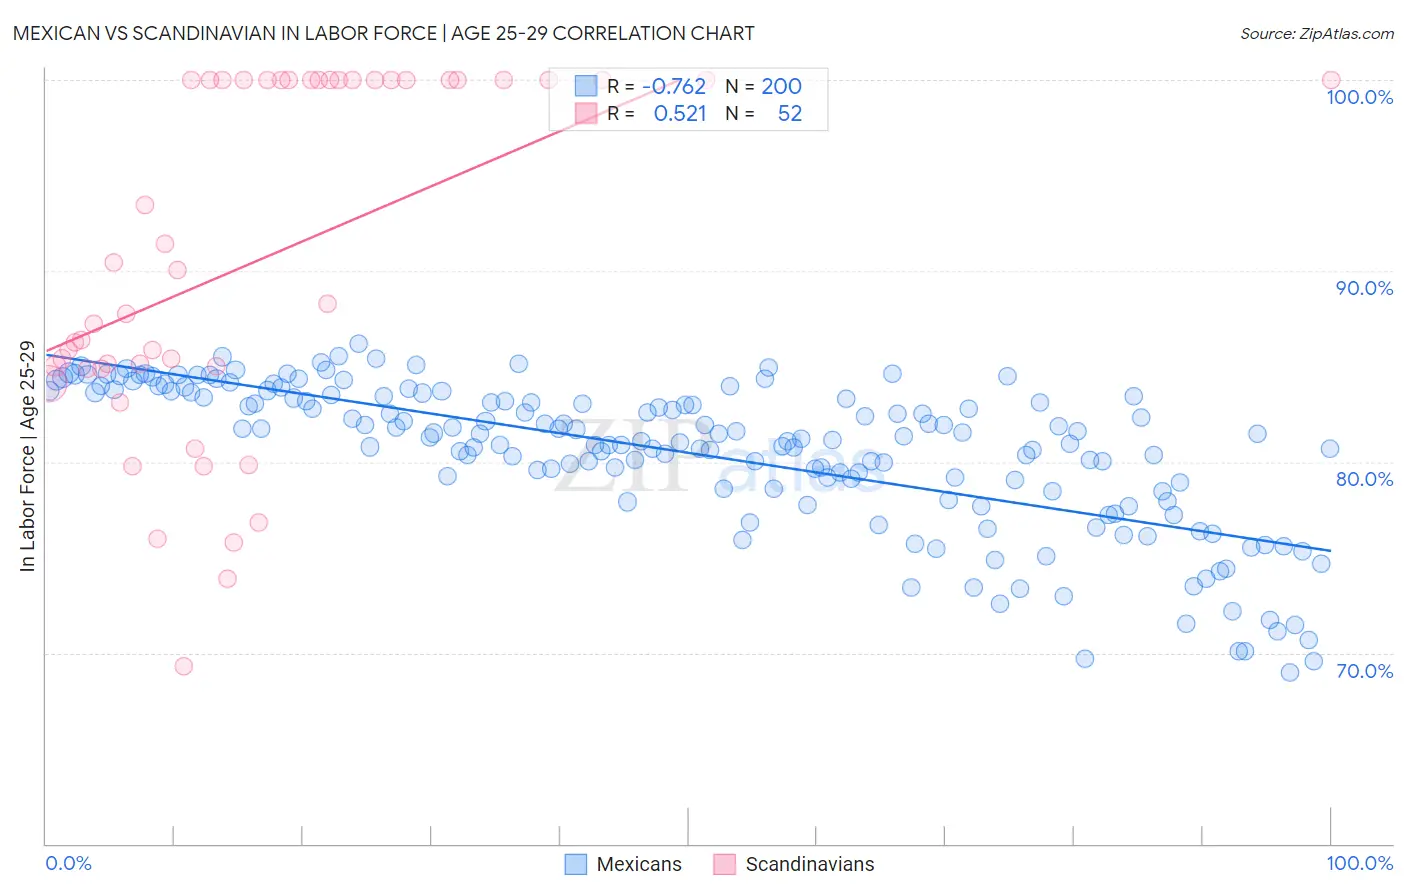
Mexican vs Scandinavian In Labor Force | Age 25-29 Correlation Chart
The statistical analysis conducted on geographies consisting of 564,184,194 people shows a strong negative correlation between the proportion of Mexicans and labor force participation rate among population between the ages 25 and 29 in the United States with a correlation coefficient (R) of -0.762 and weighted average of 81.9%. Similarly, the statistical analysis conducted on geographies consisting of 472,219,125 people shows a substantial positive correlation between the proportion of Scandinavians and labor force participation rate among population between the ages 25 and 29 in the United States with a correlation coefficient (R) of 0.521 and weighted average of 84.9%, a difference of 3.6%.
In Labor Force | Age 25-29 Correlation Summary
| Measurement | Mexican | Scandinavian |
| Minimum | 69.0% | 69.3% |
| Maximum | 86.2% | 100.0% |
| Range | 17.2% | 30.7% |
| Mean | 80.5% | 90.6% |
| Median | 81.4% | 89.2% |
| Interquartile 25% (IQ1) | 78.6% | 85.0% |
| Interquartile 75% (IQ3) | 83.5% | 100.0% |
| Interquartile Range (IQR) | 4.9% | 15.0% |
| Standard Deviation (Sample) | 3.9% | 9.1% |
| Standard Deviation (Population) | 3.9% | 9.0% |
Similar Demographics by In Labor Force | Age 25-29
Demographics Similar to Mexicans by In Labor Force | Age 25-29
In terms of in labor force | age 25-29, the demographic groups most similar to Mexicans are Chickasaw (81.9%, a difference of 0.070%), Immigrants from Mexico (82.0%, a difference of 0.090%), Comanche (81.9%, a difference of 0.090%), Cherokee (82.1%, a difference of 0.22%), and Yaqui (82.2%, a difference of 0.27%).
| Demographics | Rating | Rank | In Labor Force | Age 25-29 |
| Immigrants | Central America | 0.0 /100 | #309 | Tragic 82.4% |
| Osage | 0.0 /100 | #310 | Tragic 82.3% |
| Alaskan Athabascans | 0.0 /100 | #311 | Tragic 82.3% |
| Hispanics or Latinos | 0.0 /100 | #312 | Tragic 82.2% |
| Yaqui | 0.0 /100 | #313 | Tragic 82.2% |
| Cherokee | 0.0 /100 | #314 | Tragic 82.1% |
| Immigrants | Mexico | 0.0 /100 | #315 | Tragic 82.0% |
| Mexicans | 0.0 /100 | #316 | Tragic 81.9% |
| Chickasaw | 0.0 /100 | #317 | Tragic 81.9% |
| Comanche | 0.0 /100 | #318 | Tragic 81.9% |
| Seminole | 0.0 /100 | #319 | Tragic 81.7% |
| Colville | 0.0 /100 | #320 | Tragic 81.6% |
| Shoshone | 0.0 /100 | #321 | Tragic 81.6% |
| Kiowa | 0.0 /100 | #322 | Tragic 81.6% |
| Alaska Natives | 0.0 /100 | #323 | Tragic 81.6% |
Demographics Similar to Scandinavians by In Labor Force | Age 25-29
In terms of in labor force | age 25-29, the demographic groups most similar to Scandinavians are Dutch (84.9%, a difference of 0.0%), Immigrants from Iran (84.9%, a difference of 0.0%), Immigrants from South Africa (84.9%, a difference of 0.010%), Immigrants from Chile (84.9%, a difference of 0.010%), and Uruguayan (84.9%, a difference of 0.010%).
| Demographics | Rating | Rank | In Labor Force | Age 25-29 |
| South Africans | 88.9 /100 | #115 | Excellent 85.0% |
| Chileans | 88.8 /100 | #116 | Excellent 85.0% |
| Immigrants | Belarus | 88.0 /100 | #117 | Excellent 85.0% |
| Finns | 87.8 /100 | #118 | Excellent 85.0% |
| Filipinos | 87.1 /100 | #119 | Excellent 84.9% |
| Immigrants | South Africa | 86.1 /100 | #120 | Excellent 84.9% |
| Immigrants | Chile | 85.6 /100 | #121 | Excellent 84.9% |
| Scandinavians | 85.1 /100 | #122 | Excellent 84.9% |
| Dutch | 84.9 /100 | #123 | Excellent 84.9% |
| Immigrants | Iran | 84.8 /100 | #124 | Excellent 84.9% |
| Uruguayans | 84.7 /100 | #125 | Excellent 84.9% |
| Immigrants | Singapore | 84.4 /100 | #126 | Excellent 84.9% |
| Immigrants | Uruguay | 84.0 /100 | #127 | Excellent 84.9% |
| Australians | 83.6 /100 | #128 | Excellent 84.9% |
| Immigrants | Russia | 81.6 /100 | #129 | Excellent 84.9% |