Mexican American Indian vs Menominee Unemployment Among Ages 55 to 59 years
COMPARE
Mexican American Indian
Menominee
Unemployment Among Ages 55 to 59 years
Unemployment Among Ages 55 to 59 years Comparison
Mexican American Indians
Menominee
5.2%
UNEMPLOYMENT AMONG AGES 55 TO 59 YEARS
0.0/ 100
METRIC RATING
274th/ 347
METRIC RANK
10.5%
UNEMPLOYMENT AMONG AGES 55 TO 59 YEARS
0.0/ 100
METRIC RATING
346th/ 347
METRIC RANK
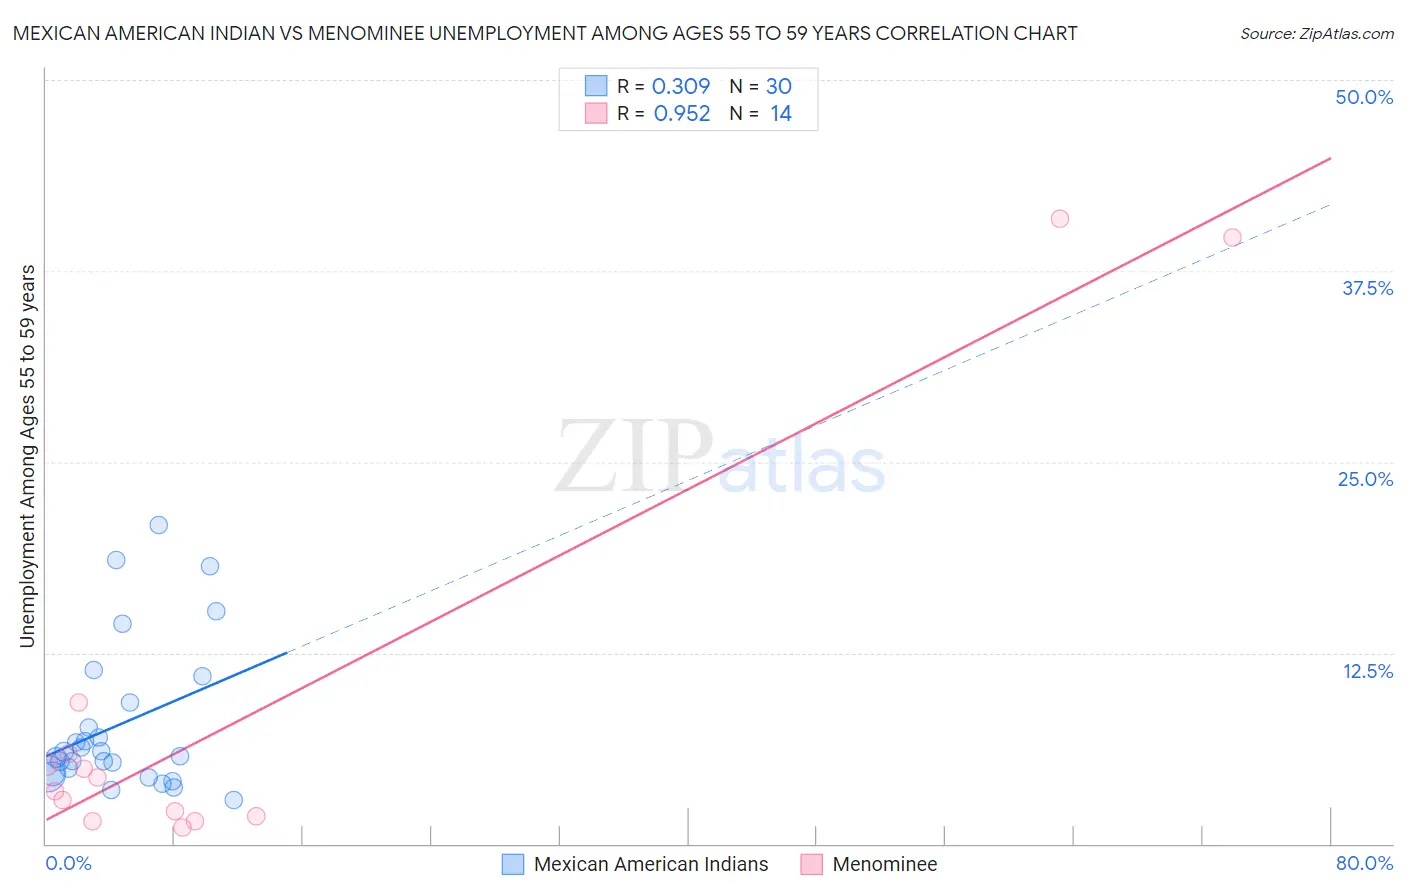
Mexican American Indian vs Menominee Unemployment Among Ages 55 to 59 years Correlation Chart
The statistical analysis conducted on geographies consisting of 299,499,153 people shows a mild positive correlation between the proportion of Mexican American Indians and unemployment rate among population between the ages 55 and 59 in the United States with a correlation coefficient (R) of 0.309 and weighted average of 5.2%. Similarly, the statistical analysis conducted on geographies consisting of 44,393,240 people shows a perfect positive correlation between the proportion of Menominee and unemployment rate among population between the ages 55 and 59 in the United States with a correlation coefficient (R) of 0.952 and weighted average of 10.5%, a difference of 102.0%.
Unemployment Among Ages 55 to 59 years Correlation Summary
| Measurement | Mexican American Indian | Menominee |
| Minimum | 2.9% | 1.1% |
| Maximum | 20.8% | 40.9% |
| Range | 17.9% | 39.8% |
| Mean | 7.8% | 8.9% |
| Median | 5.9% | 3.9% |
| Interquartile 25% (IQ1) | 4.6% | 1.8% |
| Interquartile 75% (IQ3) | 9.2% | 5.9% |
| Interquartile Range (IQR) | 4.6% | 4.1% |
| Standard Deviation (Sample) | 4.9% | 13.5% |
| Standard Deviation (Population) | 4.8% | 13.0% |
Similar Demographics by Unemployment Among Ages 55 to 59 years
Demographics Similar to Mexican American Indians by Unemployment Among Ages 55 to 59 years
In terms of unemployment among ages 55 to 59 years, the demographic groups most similar to Mexican American Indians are Israeli (5.2%, a difference of 0.10%), West Indian (5.2%, a difference of 0.11%), Ottawa (5.2%, a difference of 0.12%), Immigrants from Latin America (5.2%, a difference of 0.23%), and Immigrants from Jamaica (5.2%, a difference of 0.35%).
| Demographics | Rating | Rank | Unemployment Among Ages 55 to 59 years |
| Immigrants | Senegal | 0.1 /100 | #267 | Tragic 5.2% |
| Mexicans | 0.1 /100 | #268 | Tragic 5.2% |
| Tsimshian | 0.1 /100 | #269 | Tragic 5.2% |
| Ute | 0.1 /100 | #270 | Tragic 5.2% |
| Cree | 0.1 /100 | #271 | Tragic 5.2% |
| Immigrants | Jamaica | 0.0 /100 | #272 | Tragic 5.2% |
| Ottawa | 0.0 /100 | #273 | Tragic 5.2% |
| Mexican American Indians | 0.0 /100 | #274 | Tragic 5.2% |
| Israelis | 0.0 /100 | #275 | Tragic 5.2% |
| West Indians | 0.0 /100 | #276 | Tragic 5.2% |
| Immigrants | Latin America | 0.0 /100 | #277 | Tragic 5.2% |
| Immigrants | Barbados | 0.0 /100 | #278 | Tragic 5.2% |
| Alsatians | 0.0 /100 | #279 | Tragic 5.2% |
| Immigrants | Uzbekistan | 0.0 /100 | #280 | Tragic 5.3% |
| Guatemalans | 0.0 /100 | #281 | Tragic 5.3% |
Demographics Similar to Menominee by Unemployment Among Ages 55 to 59 years
In terms of unemployment among ages 55 to 59 years, the demographic groups most similar to Menominee are Tohono O'odham (9.3%, a difference of 13.1%), Inupiat (9.0%, a difference of 16.6%), Yakama (8.9%, a difference of 18.0%), Hopi (8.1%, a difference of 29.8%), and Yup'ik (13.9%, a difference of 32.2%).
| Demographics | Rating | Rank | Unemployment Among Ages 55 to 59 years |
| Pima | 0.0 /100 | #333 | Tragic 6.6% |
| Pueblo | 0.0 /100 | #334 | Tragic 6.7% |
| Colville | 0.0 /100 | #335 | Tragic 6.7% |
| Navajo | 0.0 /100 | #336 | Tragic 6.7% |
| Paiute | 0.0 /100 | #337 | Tragic 6.8% |
| Immigrants | Yemen | 0.0 /100 | #338 | Tragic 6.9% |
| Puerto Ricans | 0.0 /100 | #339 | Tragic 7.0% |
| Alaskan Athabascans | 0.0 /100 | #340 | Tragic 7.1% |
| Shoshone | 0.0 /100 | #341 | Tragic 7.4% |
| Hopi | 0.0 /100 | #342 | Tragic 8.1% |
| Yakama | 0.0 /100 | #343 | Tragic 8.9% |
| Inupiat | 0.0 /100 | #344 | Tragic 9.0% |
| Tohono O'odham | 0.0 /100 | #345 | Tragic 9.3% |
| Menominee | 0.0 /100 | #346 | Tragic 10.5% |
| Yup'ik | 0.0 /100 | #347 | Tragic 13.9% |