Assyrian/Chaldean/Syriac vs Hispanic or Latino In Labor Force | Age > 16
COMPARE
Assyrian/Chaldean/Syriac
Hispanic or Latino
In Labor Force | Age > 16
In Labor Force | Age > 16 Comparison
Assyrians/Chaldeans/Syriacs
Hispanics or Latinos
64.0%
IN LABOR FORCE | AGE > 16
0.3/ 100
METRIC RATING
278th/ 347
METRIC RANK
64.3%
IN LABOR FORCE | AGE > 16
1.1/ 100
METRIC RATING
255th/ 347
METRIC RANK
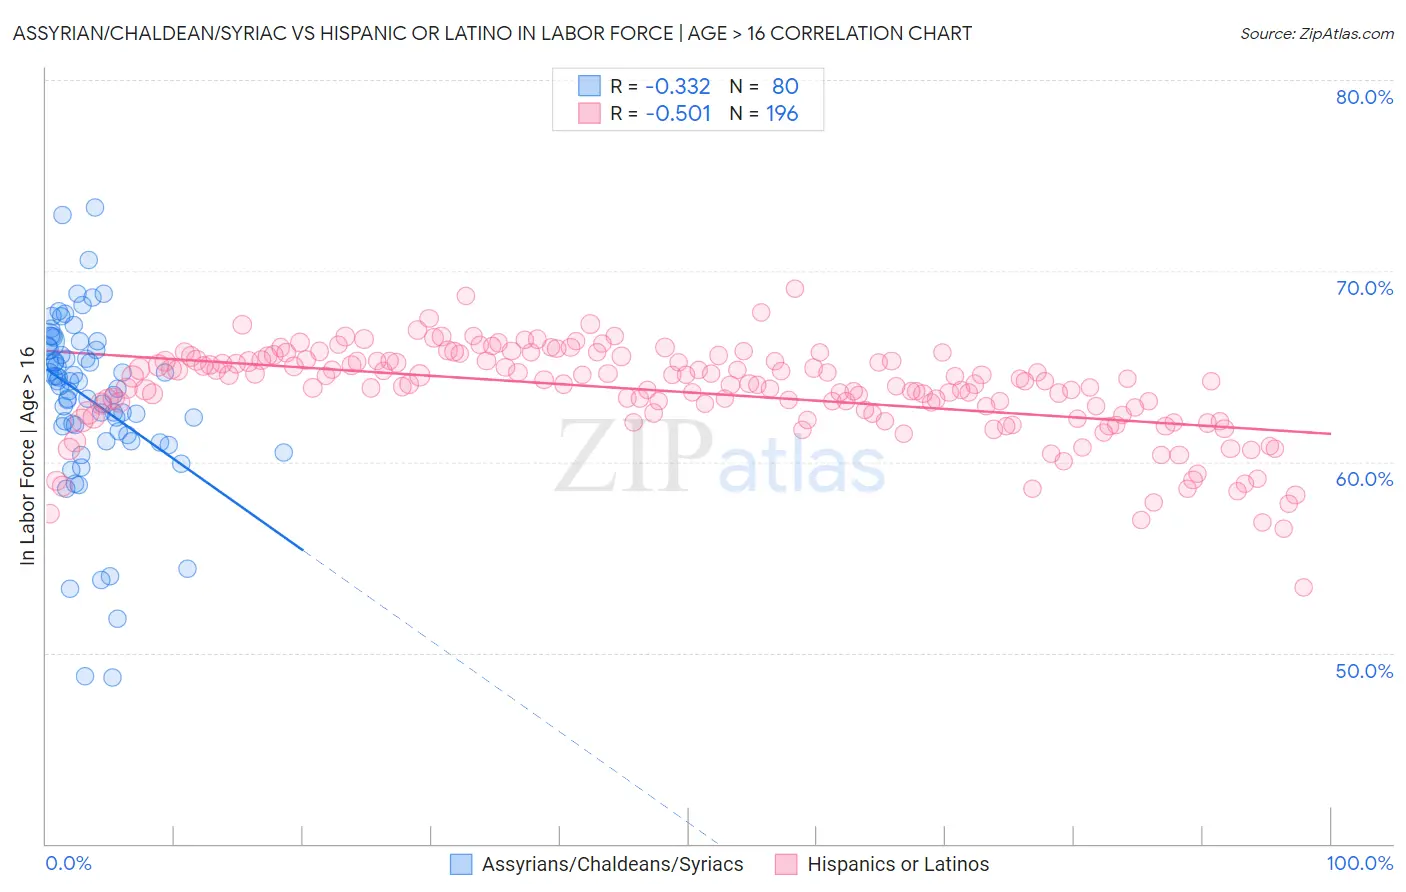
Assyrian/Chaldean/Syriac vs Hispanic or Latino In Labor Force | Age > 16 Correlation Chart
The statistical analysis conducted on geographies consisting of 110,318,125 people shows a mild negative correlation between the proportion of Assyrians/Chaldeans/Syriacs and labor force participation rate among population ages 16 and over in the United States with a correlation coefficient (R) of -0.332 and weighted average of 64.0%. Similarly, the statistical analysis conducted on geographies consisting of 574,025,710 people shows a substantial negative correlation between the proportion of Hispanics or Latinos and labor force participation rate among population ages 16 and over in the United States with a correlation coefficient (R) of -0.501 and weighted average of 64.3%, a difference of 0.42%.
In Labor Force | Age > 16 Correlation Summary
| Measurement | Assyrian/Chaldean/Syriac | Hispanic or Latino |
| Minimum | 48.7% | 53.4% |
| Maximum | 73.3% | 69.1% |
| Range | 24.6% | 15.7% |
| Mean | 63.3% | 63.7% |
| Median | 64.1% | 64.1% |
| Interquartile 25% (IQ1) | 61.5% | 62.5% |
| Interquartile 75% (IQ3) | 66.0% | 65.3% |
| Interquartile Range (IQR) | 4.5% | 2.8% |
| Standard Deviation (Sample) | 4.6% | 2.5% |
| Standard Deviation (Population) | 4.6% | 2.5% |
Similar Demographics by In Labor Force | Age > 16
Demographics Similar to Assyrians/Chaldeans/Syriacs by In Labor Force | Age > 16
In terms of in labor force | age > 16, the demographic groups most similar to Assyrians/Chaldeans/Syriacs are Immigrants from Bahamas (64.0%, a difference of 0.020%), Welsh (64.0%, a difference of 0.030%), Immigrants from St. Vincent and the Grenadines (64.0%, a difference of 0.040%), French Canadian (64.0%, a difference of 0.040%), and Mexican (64.1%, a difference of 0.050%).
| Demographics | Rating | Rank | In Labor Force | Age > 16 |
| Dominicans | 0.4 /100 | #271 | Tragic 64.1% |
| Native Hawaiians | 0.3 /100 | #272 | Tragic 64.1% |
| Hmong | 0.3 /100 | #273 | Tragic 64.1% |
| Immigrants | Cuba | 0.3 /100 | #274 | Tragic 64.1% |
| Mexicans | 0.3 /100 | #275 | Tragic 64.1% |
| French American Indians | 0.3 /100 | #276 | Tragic 64.1% |
| Immigrants | Bahamas | 0.3 /100 | #277 | Tragic 64.0% |
| Assyrians/Chaldeans/Syriacs | 0.3 /100 | #278 | Tragic 64.0% |
| Welsh | 0.2 /100 | #279 | Tragic 64.0% |
| Immigrants | St. Vincent and the Grenadines | 0.2 /100 | #280 | Tragic 64.0% |
| French Canadians | 0.2 /100 | #281 | Tragic 64.0% |
| Immigrants | Guyana | 0.2 /100 | #282 | Tragic 64.0% |
| Immigrants | Germany | 0.1 /100 | #283 | Tragic 63.9% |
| French | 0.1 /100 | #284 | Tragic 63.9% |
| Slovaks | 0.1 /100 | #285 | Tragic 63.9% |
Demographics Similar to Hispanics or Latinos by In Labor Force | Age > 16
In terms of in labor force | age > 16, the demographic groups most similar to Hispanics or Latinos are Immigrants from Mexico (64.3%, a difference of 0.040%), Immigrants from Uzbekistan (64.3%, a difference of 0.070%), Immigrants from Dominican Republic (64.4%, a difference of 0.080%), Czechoslovakian (64.3%, a difference of 0.080%), and Inupiat (64.3%, a difference of 0.080%).
| Demographics | Rating | Rank | In Labor Force | Age > 16 |
| Immigrants | Barbados | 2.1 /100 | #248 | Tragic 64.4% |
| Germans | 1.8 /100 | #249 | Tragic 64.4% |
| British West Indians | 1.8 /100 | #250 | Tragic 64.4% |
| Portuguese | 1.6 /100 | #251 | Tragic 64.4% |
| Immigrants | Dominican Republic | 1.5 /100 | #252 | Tragic 64.4% |
| Czechoslovakians | 1.4 /100 | #253 | Tragic 64.3% |
| Immigrants | Uzbekistan | 1.4 /100 | #254 | Tragic 64.3% |
| Hispanics or Latinos | 1.1 /100 | #255 | Tragic 64.3% |
| Immigrants | Mexico | 1.0 /100 | #256 | Tragic 64.3% |
| Inupiat | 0.8 /100 | #257 | Tragic 64.3% |
| Immigrants | Scotland | 0.8 /100 | #258 | Tragic 64.2% |
| Immigrants | Western Europe | 0.7 /100 | #259 | Tragic 64.2% |
| Marshallese | 0.7 /100 | #260 | Tragic 64.2% |
| Basques | 0.7 /100 | #261 | Tragic 64.2% |
| Finns | 0.7 /100 | #262 | Tragic 64.2% |