Menominee vs Spanish American Nursery School
COMPARE
Menominee
Spanish American
Nursery School
Nursery School Comparison
Menominee
Spanish Americans
98.2%
NURSERY SCHOOL
93.6/ 100
METRIC RATING
126th/ 347
METRIC RANK
98.0%
NURSERY SCHOOL
55.6/ 100
METRIC RATING
166th/ 347
METRIC RANK
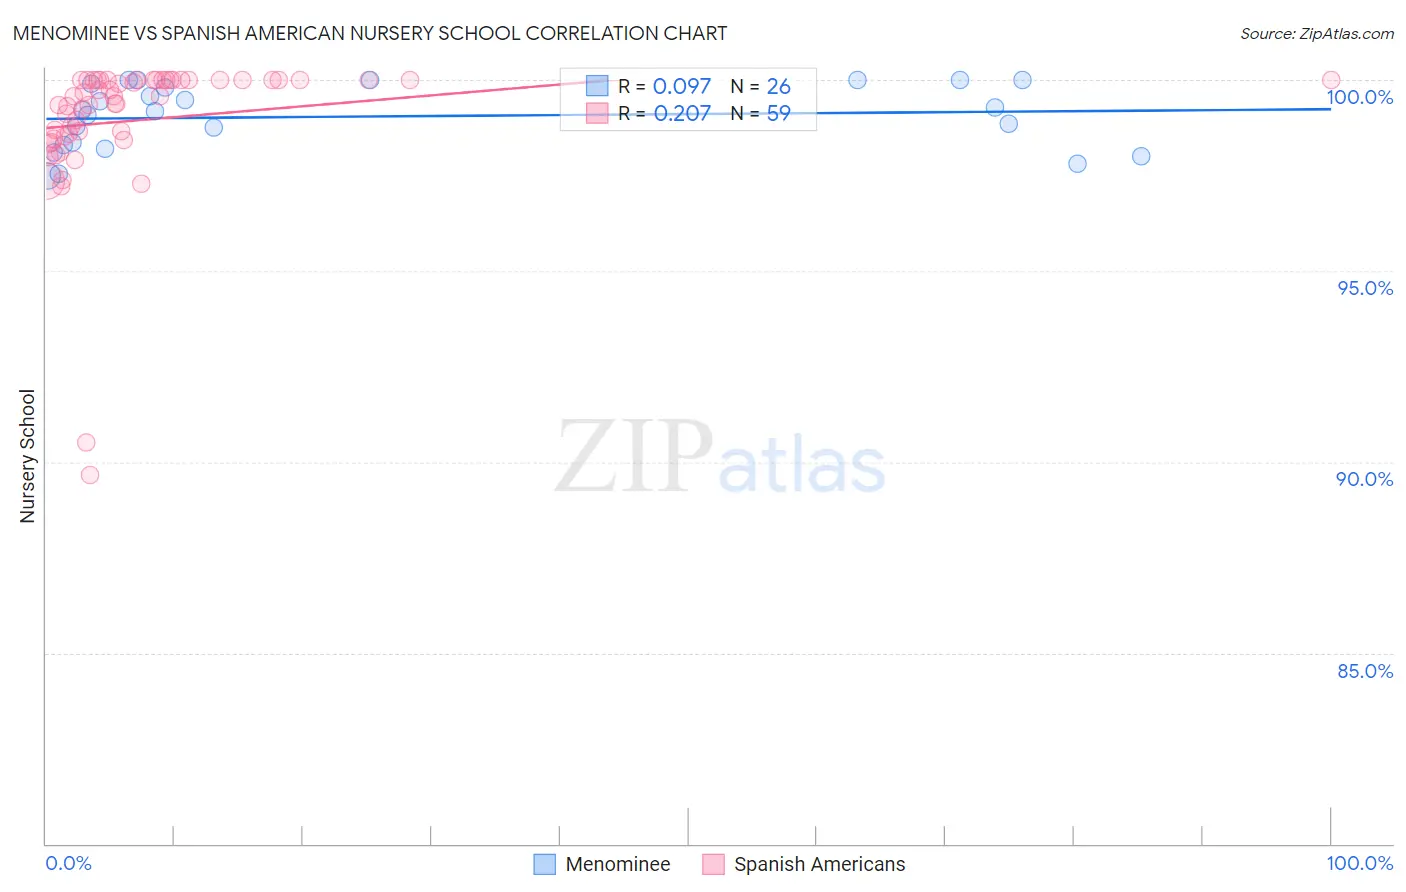
Menominee vs Spanish American Nursery School Correlation Chart
The statistical analysis conducted on geographies consisting of 45,778,979 people shows a slight positive correlation between the proportion of Menominee and percentage of population with at least nursery school education in the United States with a correlation coefficient (R) of 0.097 and weighted average of 98.2%. Similarly, the statistical analysis conducted on geographies consisting of 103,168,542 people shows a weak positive correlation between the proportion of Spanish Americans and percentage of population with at least nursery school education in the United States with a correlation coefficient (R) of 0.207 and weighted average of 98.0%, a difference of 0.18%.
Nursery School Correlation Summary
| Measurement | Menominee | Spanish American |
| Minimum | 97.5% | 89.6% |
| Maximum | 100.0% | 100.0% |
| Range | 2.5% | 10.4% |
| Mean | 99.0% | 99.0% |
| Median | 99.2% | 99.6% |
| Interquartile 25% (IQ1) | 98.3% | 98.5% |
| Interquartile 75% (IQ3) | 99.9% | 100.0% |
| Interquartile Range (IQR) | 1.6% | 1.5% |
| Standard Deviation (Sample) | 0.84% | 1.9% |
| Standard Deviation (Population) | 0.82% | 1.9% |
Similar Demographics by Nursery School
Demographics Similar to Menominee by Nursery School
In terms of nursery school, the demographic groups most similar to Menominee are Syrian (98.2%, a difference of 0.0%), Lebanese (98.2%, a difference of 0.0%), Iroquois (98.2%, a difference of 0.0%), Immigrants from Saudi Arabia (98.2%, a difference of 0.0%), and Okinawan (98.2%, a difference of 0.010%).
| Demographics | Rating | Rank | Nursery School |
| Thais | 95.0 /100 | #119 | Exceptional 98.2% |
| Okinawans | 94.5 /100 | #120 | Exceptional 98.2% |
| Immigrants | Zimbabwe | 94.2 /100 | #121 | Exceptional 98.2% |
| Immigrants | Japan | 94.0 /100 | #122 | Exceptional 98.2% |
| Syrians | 93.9 /100 | #123 | Exceptional 98.2% |
| Lebanese | 93.8 /100 | #124 | Exceptional 98.2% |
| Iroquois | 93.7 /100 | #125 | Exceptional 98.2% |
| Menominee | 93.6 /100 | #126 | Exceptional 98.2% |
| Immigrants | Saudi Arabia | 93.4 /100 | #127 | Exceptional 98.2% |
| Immigrants | Serbia | 92.4 /100 | #128 | Exceptional 98.2% |
| Cambodians | 91.4 /100 | #129 | Exceptional 98.2% |
| Immigrants | Croatia | 91.4 /100 | #130 | Exceptional 98.2% |
| Spaniards | 91.1 /100 | #131 | Exceptional 98.2% |
| Seminole | 90.9 /100 | #132 | Exceptional 98.2% |
| Immigrants | Europe | 90.7 /100 | #133 | Exceptional 98.1% |
Demographics Similar to Spanish Americans by Nursery School
In terms of nursery school, the demographic groups most similar to Spanish Americans are Ugandan (98.0%, a difference of 0.0%), Chilean (98.0%, a difference of 0.0%), Immigrants from Spain (98.0%, a difference of 0.0%), Immigrants from Micronesia (98.0%, a difference of 0.0%), and Immigrants from Russia (98.0%, a difference of 0.010%).
| Demographics | Rating | Rank | Nursery School |
| French American Indians | 62.1 /100 | #159 | Good 98.0% |
| Immigrants | Russia | 59.9 /100 | #160 | Average 98.0% |
| Immigrants | Eastern Europe | 59.7 /100 | #161 | Average 98.0% |
| Brazilians | 59.4 /100 | #162 | Average 98.0% |
| Immigrants | Italy | 59.0 /100 | #163 | Average 98.0% |
| Ugandans | 56.4 /100 | #164 | Average 98.0% |
| Chileans | 56.4 /100 | #165 | Average 98.0% |
| Spanish Americans | 55.6 /100 | #166 | Average 98.0% |
| Immigrants | Spain | 55.6 /100 | #167 | Average 98.0% |
| Immigrants | Micronesia | 55.0 /100 | #168 | Average 98.0% |
| Immigrants | Korea | 53.8 /100 | #169 | Average 98.0% |
| Bermudans | 53.7 /100 | #170 | Average 98.0% |
| Immigrants | Jordan | 53.4 /100 | #171 | Average 98.0% |
| Immigrants | Brazil | 51.3 /100 | #172 | Average 98.0% |
| Kenyans | 50.2 /100 | #173 | Average 98.0% |