Menominee vs Chilean In Labor Force | Age 16-19
COMPARE
Menominee
Chilean
In Labor Force | Age 16-19
In Labor Force | Age 16-19 Comparison
Menominee
Chileans
33.9%
IN LABOR FORCE | AGE 16-19
0.3/ 100
METRIC RATING
277th/ 347
METRIC RANK
35.8%
IN LABOR FORCE | AGE 16-19
14.6/ 100
METRIC RATING
206th/ 347
METRIC RANK
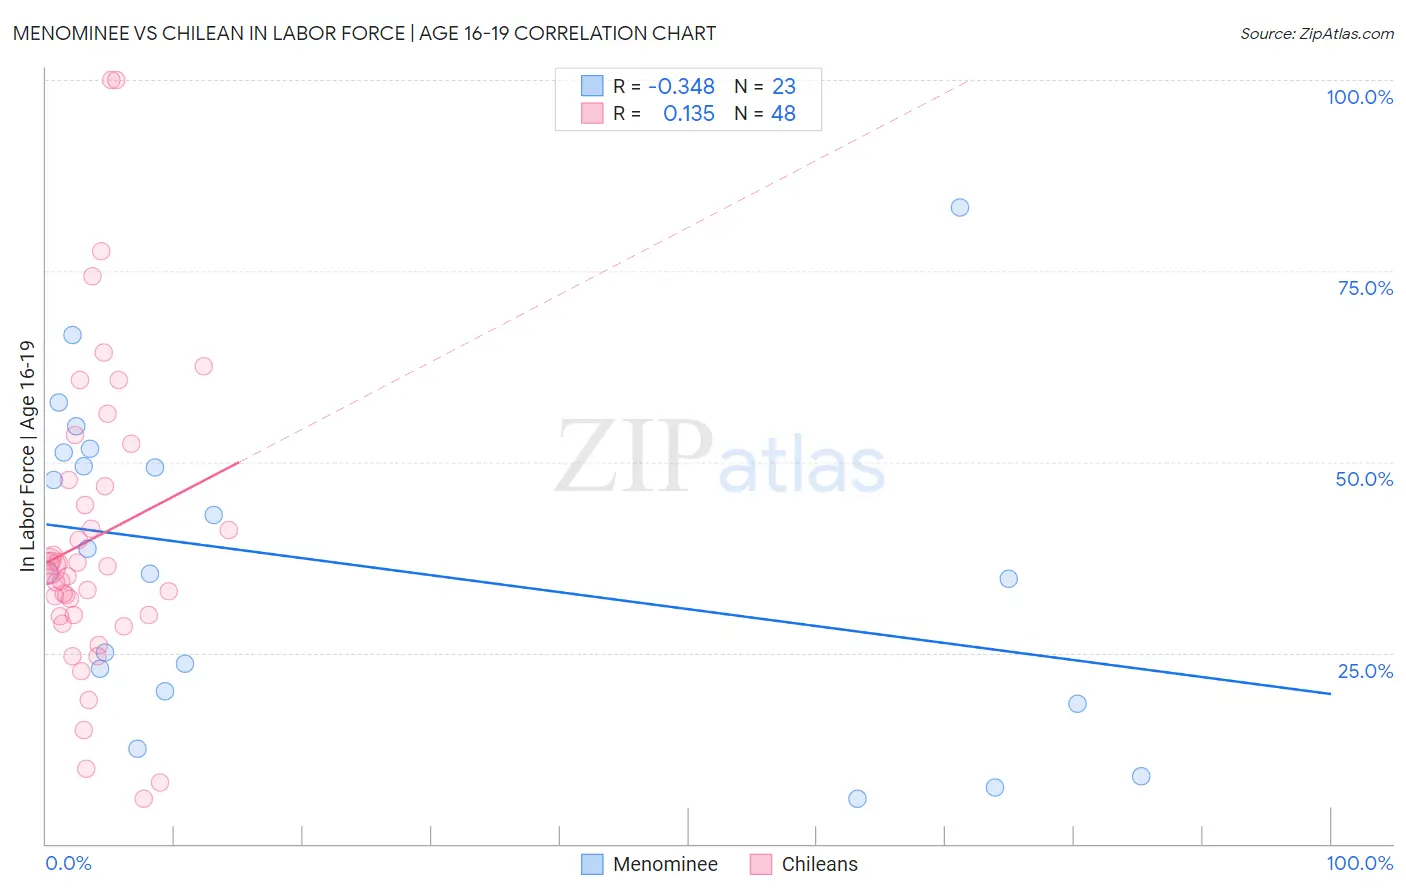
Menominee vs Chilean In Labor Force | Age 16-19 Correlation Chart
The statistical analysis conducted on geographies consisting of 45,771,172 people shows a mild negative correlation between the proportion of Menominee and labor force participation rate among population between the ages 16 and 19 in the United States with a correlation coefficient (R) of -0.348 and weighted average of 33.9%. Similarly, the statistical analysis conducted on geographies consisting of 256,483,871 people shows a poor positive correlation between the proportion of Chileans and labor force participation rate among population between the ages 16 and 19 in the United States with a correlation coefficient (R) of 0.135 and weighted average of 35.8%, a difference of 5.6%.
In Labor Force | Age 16-19 Correlation Summary
| Measurement | Menominee | Chilean |
| Minimum | 5.9% | 5.9% |
| Maximum | 83.3% | 100.0% |
| Range | 77.4% | 94.1% |
| Mean | 36.7% | 40.0% |
| Median | 35.5% | 35.8% |
| Interquartile 25% (IQ1) | 20.0% | 29.8% |
| Interquartile 75% (IQ3) | 51.3% | 47.2% |
| Interquartile Range (IQR) | 31.3% | 17.4% |
| Standard Deviation (Sample) | 20.3% | 20.0% |
| Standard Deviation (Population) | 19.8% | 19.7% |
Similar Demographics by In Labor Force | Age 16-19
Demographics Similar to Menominee by In Labor Force | Age 16-19
In terms of in labor force | age 16-19, the demographic groups most similar to Menominee are Colombian (33.8%, a difference of 0.070%), Paraguayan (33.8%, a difference of 0.080%), Taiwanese (33.8%, a difference of 0.090%), Cypriot (33.8%, a difference of 0.10%), and Immigrants from Latin America (33.9%, a difference of 0.11%).
| Demographics | Rating | Rank | In Labor Force | Age 16-19 |
| Immigrants | Russia | 0.4 /100 | #270 | Tragic 34.1% |
| Central American Indians | 0.4 /100 | #271 | Tragic 34.1% |
| Asians | 0.4 /100 | #272 | Tragic 34.1% |
| Immigrants | Panama | 0.4 /100 | #273 | Tragic 34.0% |
| Venezuelans | 0.3 /100 | #274 | Tragic 34.0% |
| Immigrants | Fiji | 0.3 /100 | #275 | Tragic 33.9% |
| Immigrants | Latin America | 0.3 /100 | #276 | Tragic 33.9% |
| Menominee | 0.3 /100 | #277 | Tragic 33.9% |
| Colombians | 0.3 /100 | #278 | Tragic 33.8% |
| Paraguayans | 0.3 /100 | #279 | Tragic 33.8% |
| Taiwanese | 0.3 /100 | #280 | Tragic 33.8% |
| Cypriots | 0.3 /100 | #281 | Tragic 33.8% |
| Immigrants | Korea | 0.3 /100 | #282 | Tragic 33.8% |
| Immigrants | Venezuela | 0.2 /100 | #283 | Tragic 33.7% |
| Immigrants | Spain | 0.2 /100 | #284 | Tragic 33.7% |
Demographics Similar to Chileans by In Labor Force | Age 16-19
In terms of in labor force | age 16-19, the demographic groups most similar to Chileans are South American Indian (35.8%, a difference of 0.0%), Immigrants from Eastern Europe (35.8%, a difference of 0.020%), Immigrants from Albania (35.8%, a difference of 0.040%), Korean (35.7%, a difference of 0.14%), and Immigrants from Nigeria (35.8%, a difference of 0.21%).
| Demographics | Rating | Rank | In Labor Force | Age 16-19 |
| Immigrants | Norway | 19.8 /100 | #199 | Poor 35.9% |
| Immigrants | Sweden | 18.8 /100 | #200 | Poor 35.9% |
| Alsatians | 17.5 /100 | #201 | Poor 35.9% |
| Senegalese | 17.4 /100 | #202 | Poor 35.9% |
| Immigrants | Nigeria | 16.8 /100 | #203 | Poor 35.8% |
| Immigrants | Albania | 15.0 /100 | #204 | Poor 35.8% |
| South American Indians | 14.6 /100 | #205 | Poor 35.8% |
| Chileans | 14.6 /100 | #206 | Poor 35.8% |
| Immigrants | Eastern Europe | 14.5 /100 | #207 | Poor 35.8% |
| Koreans | 13.3 /100 | #208 | Poor 35.7% |
| Moroccans | 12.7 /100 | #209 | Poor 35.7% |
| Immigrants | Switzerland | 11.9 /100 | #210 | Poor 35.6% |
| Mexicans | 11.9 /100 | #211 | Poor 35.6% |
| Houma | 11.0 /100 | #212 | Poor 35.6% |
| Immigrants | Bolivia | 11.0 /100 | #213 | Poor 35.6% |