Immigrants from Costa Rica vs Immigrants from Micronesia In Labor Force | Age 20-24
COMPARE
Immigrants from Costa Rica
Immigrants from Micronesia
In Labor Force | Age 20-24
In Labor Force | Age 20-24 Comparison
Immigrants from Costa Rica
Immigrants from Micronesia
74.9%
IN LABOR FORCE | AGE 20-24
36.7/ 100
METRIC RATING
183rd/ 347
METRIC RANK
77.8%
IN LABOR FORCE | AGE 20-24
100.0/ 100
METRIC RATING
27th/ 347
METRIC RANK
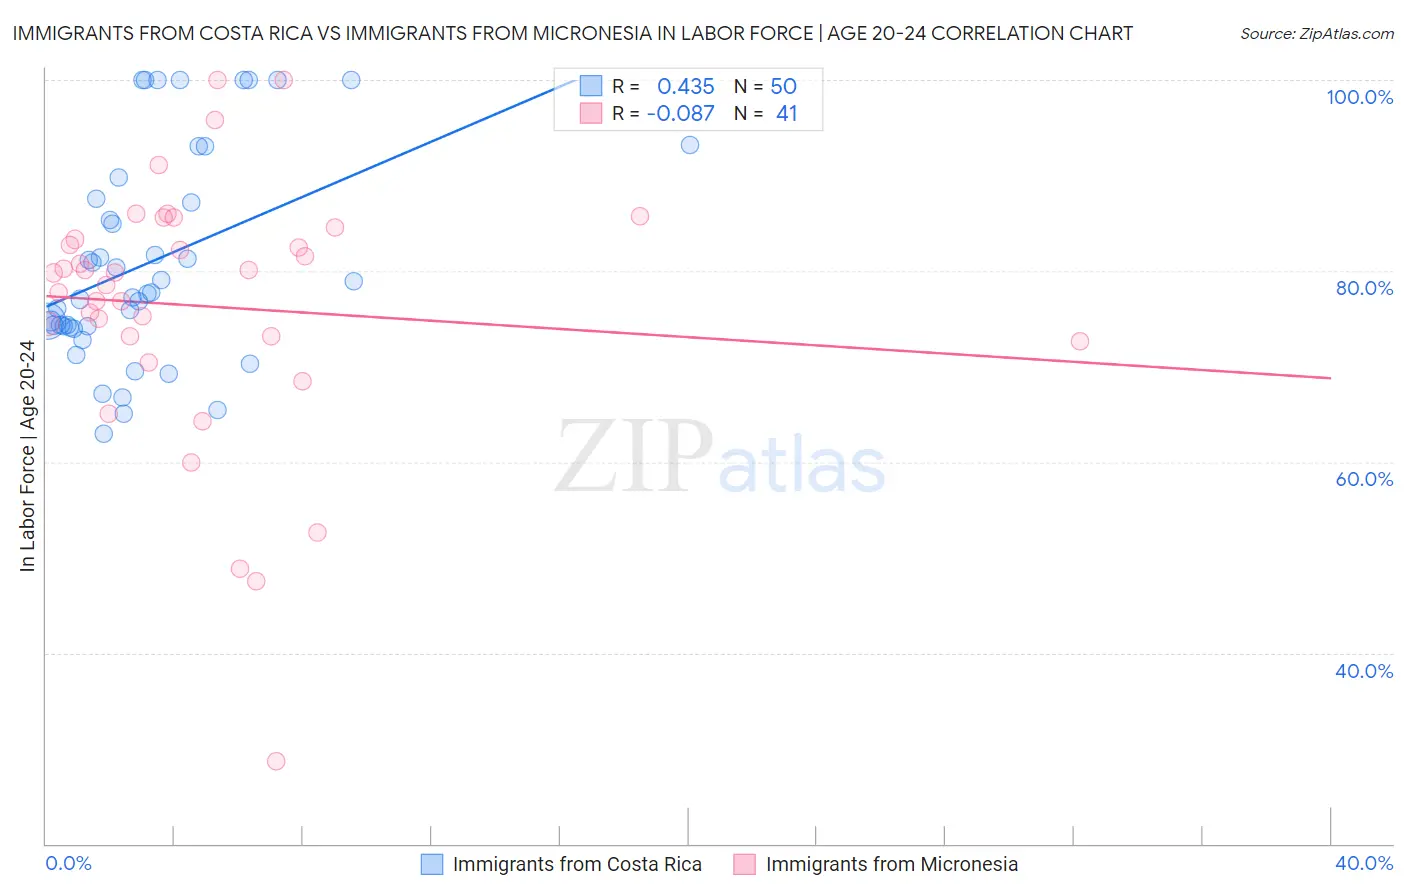
Immigrants from Costa Rica vs Immigrants from Micronesia In Labor Force | Age 20-24 Correlation Chart
The statistical analysis conducted on geographies consisting of 204,265,207 people shows a moderate positive correlation between the proportion of Immigrants from Costa Rica and labor force participation rate among population between the ages 20 and 24 in the United States with a correlation coefficient (R) of 0.435 and weighted average of 74.9%. Similarly, the statistical analysis conducted on geographies consisting of 61,601,433 people shows a slight negative correlation between the proportion of Immigrants from Micronesia and labor force participation rate among population between the ages 20 and 24 in the United States with a correlation coefficient (R) of -0.087 and weighted average of 77.8%, a difference of 3.9%.
In Labor Force | Age 20-24 Correlation Summary
| Measurement | Immigrants from Costa Rica | Immigrants from Micronesia |
| Minimum | 63.0% | 28.6% |
| Maximum | 100.0% | 100.0% |
| Range | 37.0% | 71.4% |
| Mean | 80.9% | 76.3% |
| Median | 77.7% | 79.8% |
| Interquartile 25% (IQ1) | 74.2% | 72.9% |
| Interquartile 75% (IQ3) | 87.6% | 84.0% |
| Interquartile Range (IQR) | 13.4% | 11.0% |
| Standard Deviation (Sample) | 10.9% | 13.8% |
| Standard Deviation (Population) | 10.8% | 13.6% |
Similar Demographics by In Labor Force | Age 20-24
Demographics Similar to Immigrants from Costa Rica by In Labor Force | Age 20-24
In terms of in labor force | age 20-24, the demographic groups most similar to Immigrants from Costa Rica are Immigrants from South Africa (74.9%, a difference of 0.0%), Immigrants from Hungary (74.9%, a difference of 0.030%), Sri Lankan (74.9%, a difference of 0.030%), Immigrants from Eastern Europe (74.9%, a difference of 0.050%), and Immigrants from Honduras (74.9%, a difference of 0.050%).
| Demographics | Rating | Rank | In Labor Force | Age 20-24 |
| Central Americans | 48.7 /100 | #176 | Average 75.0% |
| Immigrants | Mexico | 47.8 /100 | #177 | Average 75.0% |
| Immigrants | Central America | 45.0 /100 | #178 | Average 75.0% |
| Immigrants | Latvia | 44.1 /100 | #179 | Average 75.0% |
| Immigrants | Czechoslovakia | 44.0 /100 | #180 | Average 75.0% |
| Africans | 42.5 /100 | #181 | Average 75.0% |
| Immigrants | South Africa | 36.9 /100 | #182 | Fair 74.9% |
| Immigrants | Costa Rica | 36.7 /100 | #183 | Fair 74.9% |
| Immigrants | Hungary | 35.0 /100 | #184 | Fair 74.9% |
| Sri Lankans | 34.9 /100 | #185 | Fair 74.9% |
| Immigrants | Eastern Europe | 33.8 /100 | #186 | Fair 74.9% |
| Immigrants | Honduras | 33.5 /100 | #187 | Fair 74.9% |
| Hondurans | 32.7 /100 | #188 | Fair 74.8% |
| Immigrants | Northern Europe | 32.6 /100 | #189 | Fair 74.8% |
| Russians | 32.2 /100 | #190 | Fair 74.8% |
Demographics Similar to Immigrants from Micronesia by In Labor Force | Age 20-24
In terms of in labor force | age 20-24, the demographic groups most similar to Immigrants from Micronesia are Belgian (77.8%, a difference of 0.040%), Tongan (77.9%, a difference of 0.12%), Slovak (77.7%, a difference of 0.12%), Tlingit-Haida (77.9%, a difference of 0.14%), and Swiss (77.7%, a difference of 0.14%).
| Demographics | Rating | Rank | In Labor Force | Age 20-24 |
| French Canadians | 100.0 /100 | #20 | Exceptional 78.1% |
| Puget Sound Salish | 100.0 /100 | #21 | Exceptional 78.0% |
| Pennsylvania Germans | 100.0 /100 | #22 | Exceptional 78.0% |
| Yugoslavians | 100.0 /100 | #23 | Exceptional 78.0% |
| Liberians | 100.0 /100 | #24 | Exceptional 78.0% |
| Tlingit-Haida | 100.0 /100 | #25 | Exceptional 77.9% |
| Tongans | 100.0 /100 | #26 | Exceptional 77.9% |
| Immigrants | Micronesia | 100.0 /100 | #27 | Exceptional 77.8% |
| Belgians | 100.0 /100 | #28 | Exceptional 77.8% |
| Slovaks | 100.0 /100 | #29 | Exceptional 77.7% |
| Swiss | 100.0 /100 | #30 | Exceptional 77.7% |
| Poles | 100.0 /100 | #31 | Exceptional 77.6% |
| English | 100.0 /100 | #32 | Exceptional 77.6% |
| Immigrants | Ethiopia | 100.0 /100 | #33 | Exceptional 77.5% |
| German Russians | 100.0 /100 | #34 | Exceptional 77.5% |