Immigrants from Turkey vs Immigrants from Micronesia In Labor Force | Age 20-24
COMPARE
Immigrants from Turkey
Immigrants from Micronesia
In Labor Force | Age 20-24
In Labor Force | Age 20-24 Comparison
Immigrants from Turkey
Immigrants from Micronesia
73.7%
IN LABOR FORCE | AGE 20-24
0.7/ 100
METRIC RATING
260th/ 347
METRIC RANK
77.8%
IN LABOR FORCE | AGE 20-24
100.0/ 100
METRIC RATING
27th/ 347
METRIC RANK
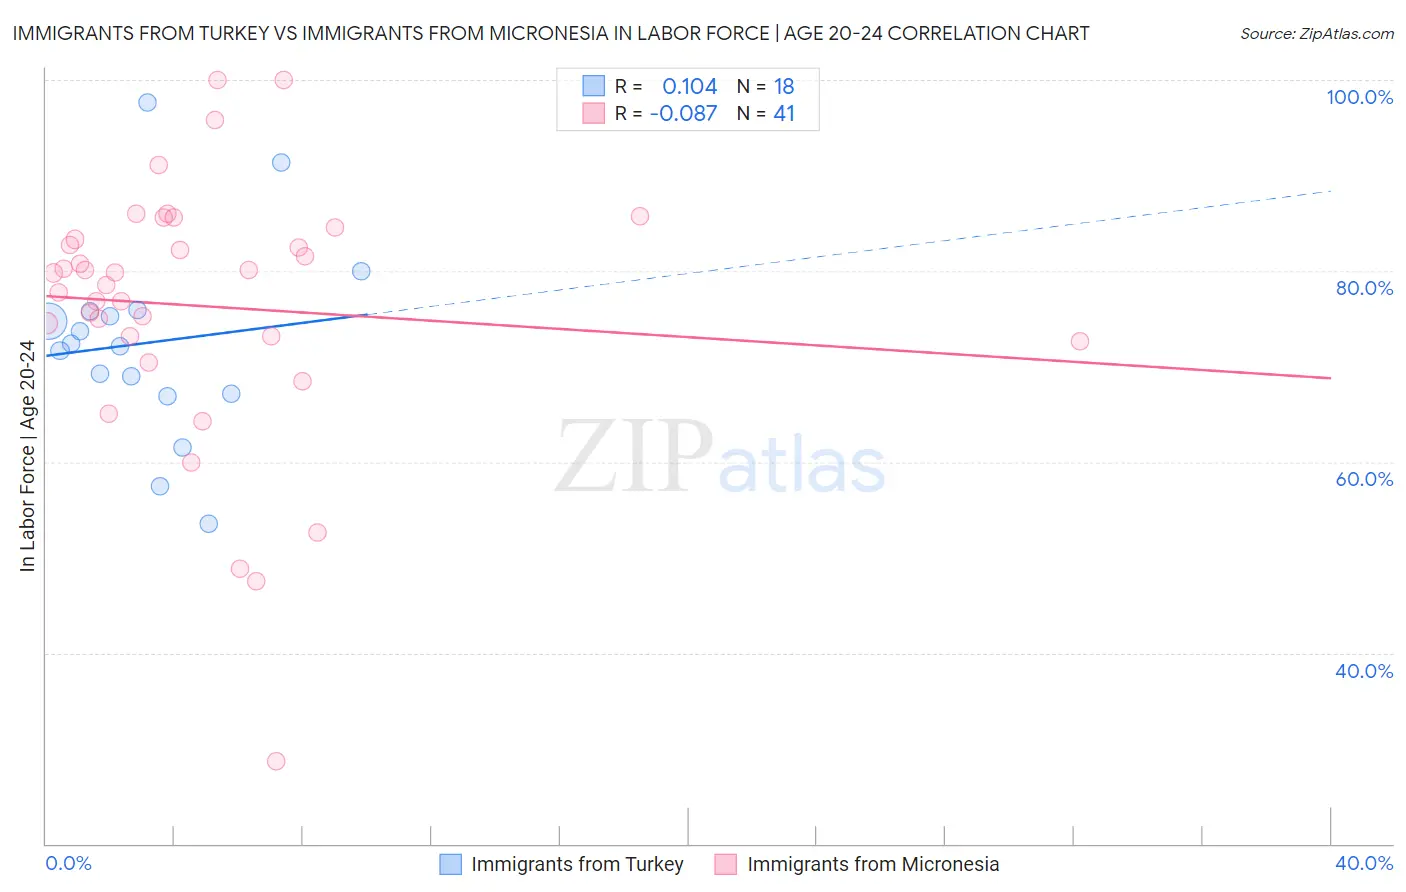
Immigrants from Turkey vs Immigrants from Micronesia In Labor Force | Age 20-24 Correlation Chart
The statistical analysis conducted on geographies consisting of 223,027,856 people shows a poor positive correlation between the proportion of Immigrants from Turkey and labor force participation rate among population between the ages 20 and 24 in the United States with a correlation coefficient (R) of 0.104 and weighted average of 73.7%. Similarly, the statistical analysis conducted on geographies consisting of 61,601,433 people shows a slight negative correlation between the proportion of Immigrants from Micronesia and labor force participation rate among population between the ages 20 and 24 in the United States with a correlation coefficient (R) of -0.087 and weighted average of 77.8%, a difference of 5.6%.
In Labor Force | Age 20-24 Correlation Summary
| Measurement | Immigrants from Turkey | Immigrants from Micronesia |
| Minimum | 53.5% | 28.6% |
| Maximum | 97.7% | 100.0% |
| Range | 44.2% | 71.4% |
| Mean | 72.5% | 76.3% |
| Median | 72.2% | 79.8% |
| Interquartile 25% (IQ1) | 67.1% | 72.9% |
| Interquartile 75% (IQ3) | 75.7% | 84.0% |
| Interquartile Range (IQR) | 8.6% | 11.0% |
| Standard Deviation (Sample) | 10.5% | 13.8% |
| Standard Deviation (Population) | 10.2% | 13.6% |
Similar Demographics by In Labor Force | Age 20-24
Demographics Similar to Immigrants from Turkey by In Labor Force | Age 20-24
In terms of in labor force | age 20-24, the demographic groups most similar to Immigrants from Turkey are Houma (73.7%, a difference of 0.010%), Asian (73.7%, a difference of 0.020%), Egyptian (73.7%, a difference of 0.030%), Dutch West Indian (73.7%, a difference of 0.030%), and Paraguayan (73.7%, a difference of 0.070%).
| Demographics | Rating | Rank | In Labor Force | Age 20-24 |
| Arapaho | 1.0 /100 | #253 | Tragic 73.8% |
| Ute | 1.0 /100 | #254 | Tragic 73.8% |
| Immigrants | Pakistan | 0.9 /100 | #255 | Tragic 73.8% |
| Spanish American Indians | 0.8 /100 | #256 | Tragic 73.7% |
| Paraguayans | 0.8 /100 | #257 | Tragic 73.7% |
| Egyptians | 0.7 /100 | #258 | Tragic 73.7% |
| Dutch West Indians | 0.7 /100 | #259 | Tragic 73.7% |
| Immigrants | Turkey | 0.7 /100 | #260 | Tragic 73.7% |
| Houma | 0.6 /100 | #261 | Tragic 73.7% |
| Asians | 0.6 /100 | #262 | Tragic 73.7% |
| Immigrants | Asia | 0.5 /100 | #263 | Tragic 73.6% |
| Immigrants | Haiti | 0.5 /100 | #264 | Tragic 73.6% |
| Burmese | 0.5 /100 | #265 | Tragic 73.6% |
| Haitians | 0.5 /100 | #266 | Tragic 73.6% |
| Immigrants | Western Asia | 0.4 /100 | #267 | Tragic 73.5% |
Demographics Similar to Immigrants from Micronesia by In Labor Force | Age 20-24
In terms of in labor force | age 20-24, the demographic groups most similar to Immigrants from Micronesia are Belgian (77.8%, a difference of 0.040%), Tongan (77.9%, a difference of 0.12%), Slovak (77.7%, a difference of 0.12%), Tlingit-Haida (77.9%, a difference of 0.14%), and Swiss (77.7%, a difference of 0.14%).
| Demographics | Rating | Rank | In Labor Force | Age 20-24 |
| French Canadians | 100.0 /100 | #20 | Exceptional 78.1% |
| Puget Sound Salish | 100.0 /100 | #21 | Exceptional 78.0% |
| Pennsylvania Germans | 100.0 /100 | #22 | Exceptional 78.0% |
| Yugoslavians | 100.0 /100 | #23 | Exceptional 78.0% |
| Liberians | 100.0 /100 | #24 | Exceptional 78.0% |
| Tlingit-Haida | 100.0 /100 | #25 | Exceptional 77.9% |
| Tongans | 100.0 /100 | #26 | Exceptional 77.9% |
| Immigrants | Micronesia | 100.0 /100 | #27 | Exceptional 77.8% |
| Belgians | 100.0 /100 | #28 | Exceptional 77.8% |
| Slovaks | 100.0 /100 | #29 | Exceptional 77.7% |
| Swiss | 100.0 /100 | #30 | Exceptional 77.7% |
| Poles | 100.0 /100 | #31 | Exceptional 77.6% |
| English | 100.0 /100 | #32 | Exceptional 77.6% |
| Immigrants | Ethiopia | 100.0 /100 | #33 | Exceptional 77.5% |
| German Russians | 100.0 /100 | #34 | Exceptional 77.5% |