Immigrants from Spain vs Alaska Native In Labor Force | Age 20-64
COMPARE
Immigrants from Spain
Alaska Native
In Labor Force | Age 20-64
In Labor Force | Age 20-64 Comparison
Immigrants from Spain
Alaska Natives
79.8%
IN LABOR FORCE | AGE 20-64
83.9/ 100
METRIC RATING
139th/ 347
METRIC RANK
77.0%
IN LABOR FORCE | AGE 20-64
0.0/ 100
METRIC RATING
308th/ 347
METRIC RANK
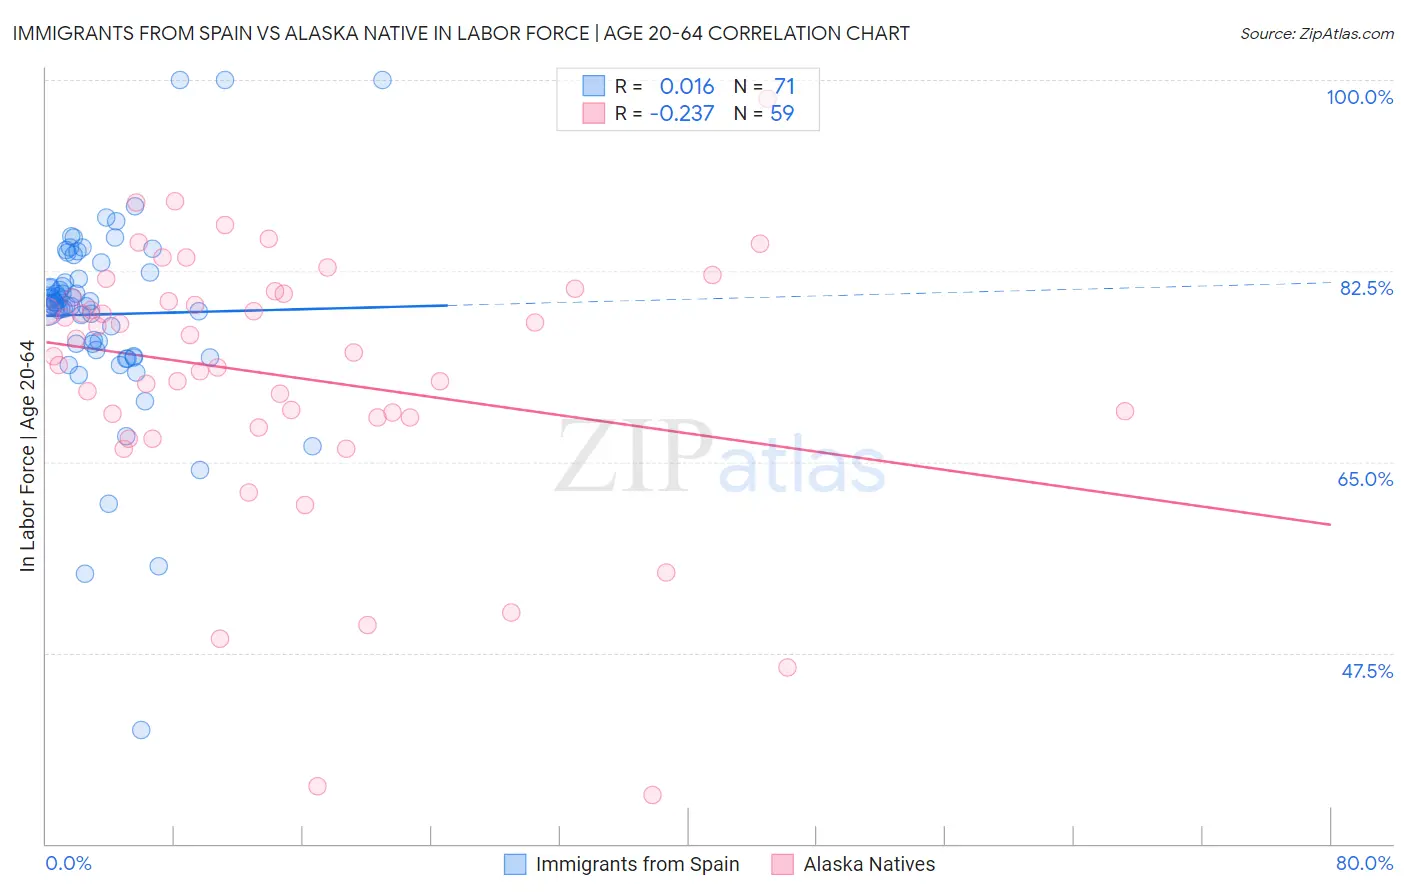
Immigrants from Spain vs Alaska Native In Labor Force | Age 20-64 Correlation Chart
The statistical analysis conducted on geographies consisting of 239,685,771 people shows no correlation between the proportion of Immigrants from Spain and labor force participation rate among population between the ages 20 and 64 in the United States with a correlation coefficient (R) of 0.016 and weighted average of 79.8%. Similarly, the statistical analysis conducted on geographies consisting of 76,778,887 people shows a weak negative correlation between the proportion of Alaska Natives and labor force participation rate among population between the ages 20 and 64 in the United States with a correlation coefficient (R) of -0.237 and weighted average of 77.0%, a difference of 3.6%.
In Labor Force | Age 20-64 Correlation Summary
| Measurement | Immigrants from Spain | Alaska Native |
| Minimum | 40.4% | 34.5% |
| Maximum | 100.0% | 98.3% |
| Range | 59.6% | 63.8% |
| Mean | 78.5% | 72.8% |
| Median | 79.4% | 75.0% |
| Interquartile 25% (IQ1) | 75.2% | 69.1% |
| Interquartile 75% (IQ3) | 82.4% | 80.4% |
| Interquartile Range (IQR) | 7.2% | 11.3% |
| Standard Deviation (Sample) | 9.1% | 12.4% |
| Standard Deviation (Population) | 9.0% | 12.3% |
Similar Demographics by In Labor Force | Age 20-64
Demographics Similar to Immigrants from Spain by In Labor Force | Age 20-64
In terms of in labor force | age 20-64, the demographic groups most similar to Immigrants from Spain are Immigrants from Ukraine (79.9%, a difference of 0.040%), Immigrants from Nigeria (79.9%, a difference of 0.040%), Ukrainian (79.9%, a difference of 0.050%), Immigrants from Singapore (79.9%, a difference of 0.050%), and Immigrants from South Eastern Asia (79.8%, a difference of 0.050%).
| Demographics | Rating | Rank | In Labor Force | Age 20-64 |
| Indians (Asian) | 87.7 /100 | #132 | Excellent 79.9% |
| South American Indians | 87.6 /100 | #133 | Excellent 79.9% |
| Belgians | 87.4 /100 | #134 | Excellent 79.9% |
| Ukrainians | 86.8 /100 | #135 | Excellent 79.9% |
| Immigrants | Singapore | 86.7 /100 | #136 | Excellent 79.9% |
| Immigrants | Ukraine | 86.5 /100 | #137 | Excellent 79.9% |
| Immigrants | Nigeria | 86.4 /100 | #138 | Excellent 79.9% |
| Immigrants | Spain | 83.9 /100 | #139 | Excellent 79.8% |
| Immigrants | South Eastern Asia | 80.4 /100 | #140 | Excellent 79.8% |
| Immigrants | Israel | 80.0 /100 | #141 | Good 79.8% |
| Slovaks | 79.9 /100 | #142 | Good 79.8% |
| Immigrants | Sweden | 79.7 /100 | #143 | Good 79.8% |
| Koreans | 79.6 /100 | #144 | Good 79.8% |
| Pakistanis | 79.3 /100 | #145 | Good 79.8% |
| Immigrants | Southern Europe | 78.9 /100 | #146 | Good 79.8% |
Demographics Similar to Alaska Natives by In Labor Force | Age 20-64
In terms of in labor force | age 20-64, the demographic groups most similar to Alaska Natives are American (77.0%, a difference of 0.010%), Comanche (77.0%, a difference of 0.020%), Central American Indian (77.1%, a difference of 0.060%), Blackfeet (77.0%, a difference of 0.060%), and Potawatomi (77.2%, a difference of 0.23%).
| Demographics | Rating | Rank | In Labor Force | Age 20-64 |
| Nepalese | 0.0 /100 | #301 | Tragic 77.5% |
| Iroquois | 0.0 /100 | #302 | Tragic 77.5% |
| Chippewa | 0.0 /100 | #303 | Tragic 77.3% |
| Immigrants | Mexico | 0.0 /100 | #304 | Tragic 77.3% |
| Mexicans | 0.0 /100 | #305 | Tragic 77.2% |
| Potawatomi | 0.0 /100 | #306 | Tragic 77.2% |
| Central American Indians | 0.0 /100 | #307 | Tragic 77.1% |
| Alaska Natives | 0.0 /100 | #308 | Tragic 77.0% |
| Americans | 0.0 /100 | #309 | Tragic 77.0% |
| Comanche | 0.0 /100 | #310 | Tragic 77.0% |
| Blackfeet | 0.0 /100 | #311 | Tragic 77.0% |
| Alaskan Athabascans | 0.0 /100 | #312 | Tragic 76.9% |
| Shoshone | 0.0 /100 | #313 | Tragic 76.8% |
| Blacks/African Americans | 0.0 /100 | #314 | Tragic 76.8% |
| Ottawa | 0.0 /100 | #315 | Tragic 76.7% |