Lebanese vs Alaska Native In Labor Force | Age 20-64
COMPARE
Lebanese
Alaska Native
In Labor Force | Age 20-64
In Labor Force | Age 20-64 Comparison
Lebanese
Alaska Natives
79.1%
IN LABOR FORCE | AGE 20-64
5.1/ 100
METRIC RATING
231st/ 347
METRIC RANK
77.0%
IN LABOR FORCE | AGE 20-64
0.0/ 100
METRIC RATING
308th/ 347
METRIC RANK
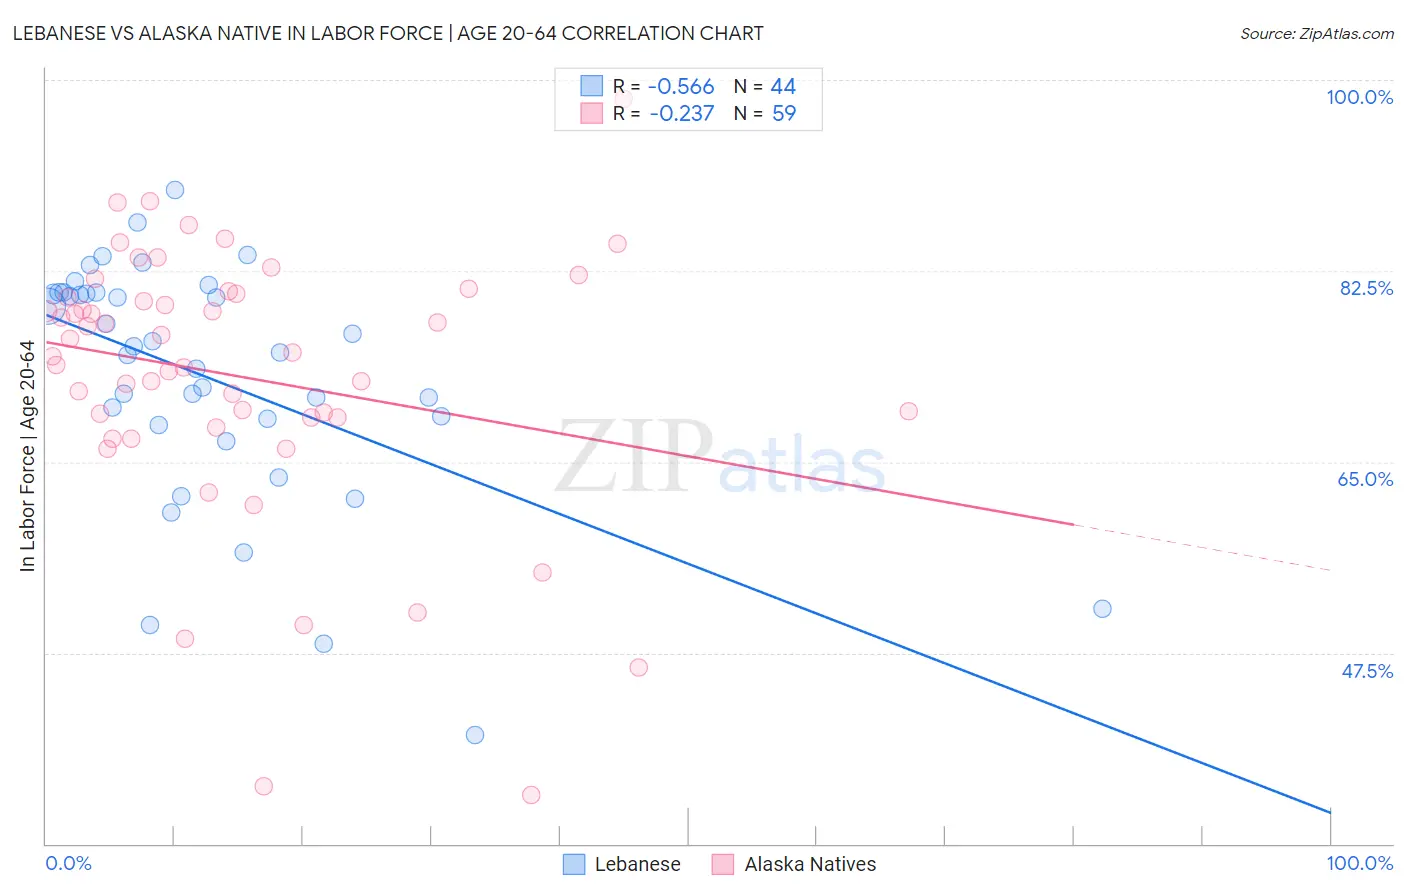
Lebanese vs Alaska Native In Labor Force | Age 20-64 Correlation Chart
The statistical analysis conducted on geographies consisting of 401,626,649 people shows a substantial negative correlation between the proportion of Lebanese and labor force participation rate among population between the ages 20 and 64 in the United States with a correlation coefficient (R) of -0.566 and weighted average of 79.1%. Similarly, the statistical analysis conducted on geographies consisting of 76,778,887 people shows a weak negative correlation between the proportion of Alaska Natives and labor force participation rate among population between the ages 20 and 64 in the United States with a correlation coefficient (R) of -0.237 and weighted average of 77.0%, a difference of 2.7%.
In Labor Force | Age 20-64 Correlation Summary
| Measurement | Lebanese | Alaska Native |
| Minimum | 40.0% | 34.5% |
| Maximum | 89.9% | 98.3% |
| Range | 49.9% | 63.8% |
| Mean | 72.7% | 72.8% |
| Median | 75.3% | 75.0% |
| Interquartile 25% (IQ1) | 68.6% | 69.1% |
| Interquartile 75% (IQ3) | 80.5% | 80.4% |
| Interquartile Range (IQR) | 11.9% | 11.3% |
| Standard Deviation (Sample) | 11.0% | 12.4% |
| Standard Deviation (Population) | 10.9% | 12.3% |
Similar Demographics by In Labor Force | Age 20-64
Demographics Similar to Lebanese by In Labor Force | Age 20-64
In terms of in labor force | age 20-64, the demographic groups most similar to Lebanese are Panamanian (79.1%, a difference of 0.020%), Alsatian (79.1%, a difference of 0.020%), Native Hawaiian (79.1%, a difference of 0.020%), Guamanian/Chamorro (79.1%, a difference of 0.020%), and Central American (79.1%, a difference of 0.030%).
| Demographics | Rating | Rank | In Labor Force | Age 20-64 |
| Immigrants | Uzbekistan | 6.8 /100 | #224 | Tragic 79.1% |
| Portuguese | 6.4 /100 | #225 | Tragic 79.1% |
| Central Americans | 5.9 /100 | #226 | Tragic 79.1% |
| Immigrants | Western Europe | 5.9 /100 | #227 | Tragic 79.1% |
| Panamanians | 5.7 /100 | #228 | Tragic 79.1% |
| Alsatians | 5.7 /100 | #229 | Tragic 79.1% |
| Native Hawaiians | 5.6 /100 | #230 | Tragic 79.1% |
| Lebanese | 5.1 /100 | #231 | Tragic 79.1% |
| Guamanians/Chamorros | 4.5 /100 | #232 | Tragic 79.1% |
| Japanese | 4.0 /100 | #233 | Tragic 79.1% |
| Immigrants | Canada | 3.2 /100 | #234 | Tragic 79.0% |
| Tlingit-Haida | 3.2 /100 | #235 | Tragic 79.0% |
| Samoans | 2.9 /100 | #236 | Tragic 79.0% |
| Immigrants | North America | 2.9 /100 | #237 | Tragic 79.0% |
| Immigrants | Jamaica | 2.6 /100 | #238 | Tragic 79.0% |
Demographics Similar to Alaska Natives by In Labor Force | Age 20-64
In terms of in labor force | age 20-64, the demographic groups most similar to Alaska Natives are American (77.0%, a difference of 0.010%), Comanche (77.0%, a difference of 0.020%), Central American Indian (77.1%, a difference of 0.060%), Blackfeet (77.0%, a difference of 0.060%), and Potawatomi (77.2%, a difference of 0.23%).
| Demographics | Rating | Rank | In Labor Force | Age 20-64 |
| Nepalese | 0.0 /100 | #301 | Tragic 77.5% |
| Iroquois | 0.0 /100 | #302 | Tragic 77.5% |
| Chippewa | 0.0 /100 | #303 | Tragic 77.3% |
| Immigrants | Mexico | 0.0 /100 | #304 | Tragic 77.3% |
| Mexicans | 0.0 /100 | #305 | Tragic 77.2% |
| Potawatomi | 0.0 /100 | #306 | Tragic 77.2% |
| Central American Indians | 0.0 /100 | #307 | Tragic 77.1% |
| Alaska Natives | 0.0 /100 | #308 | Tragic 77.0% |
| Americans | 0.0 /100 | #309 | Tragic 77.0% |
| Comanche | 0.0 /100 | #310 | Tragic 77.0% |
| Blackfeet | 0.0 /100 | #311 | Tragic 77.0% |
| Alaskan Athabascans | 0.0 /100 | #312 | Tragic 76.9% |
| Shoshone | 0.0 /100 | #313 | Tragic 76.8% |
| Blacks/African Americans | 0.0 /100 | #314 | Tragic 76.8% |
| Ottawa | 0.0 /100 | #315 | Tragic 76.7% |