Choctaw vs Immigrants from Yemen In Labor Force | Age 30-34
COMPARE
Choctaw
Immigrants from Yemen
In Labor Force | Age 30-34
In Labor Force | Age 30-34 Comparison
Choctaw
Immigrants from Yemen
81.4%
IN LABOR FORCE | AGE 30-34
0.0/ 100
METRIC RATING
318th/ 347
METRIC RANK
78.2%
IN LABOR FORCE | AGE 30-34
0.0/ 100
METRIC RATING
341st/ 347
METRIC RANK
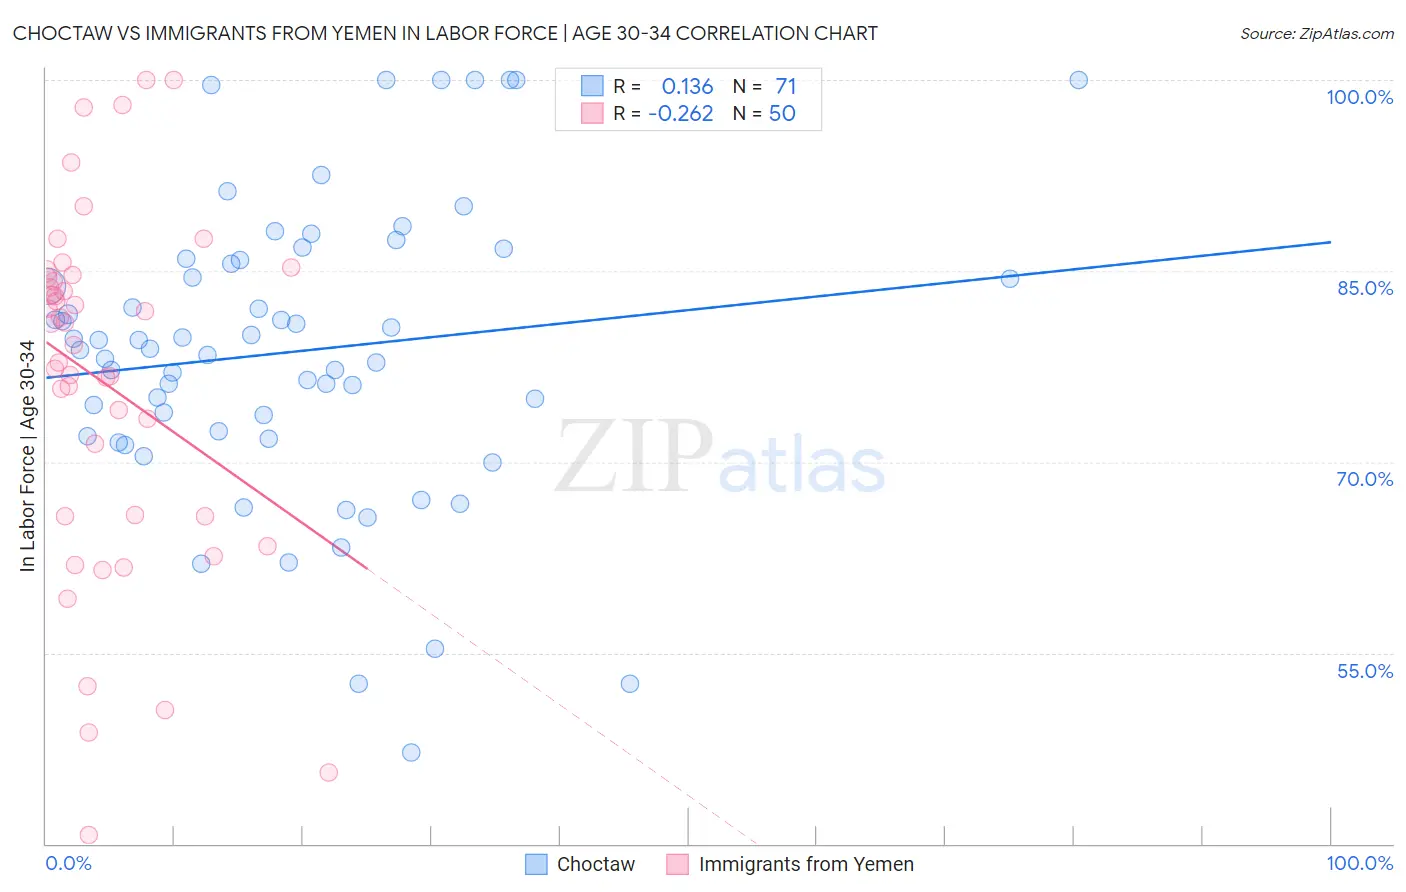
Choctaw vs Immigrants from Yemen In Labor Force | Age 30-34 Correlation Chart
The statistical analysis conducted on geographies consisting of 269,615,470 people shows a poor positive correlation between the proportion of Choctaw and labor force participation rate among population between the ages 30 and 34 in the United States with a correlation coefficient (R) of 0.136 and weighted average of 81.4%. Similarly, the statistical analysis conducted on geographies consisting of 82,432,494 people shows a weak negative correlation between the proportion of Immigrants from Yemen and labor force participation rate among population between the ages 30 and 34 in the United States with a correlation coefficient (R) of -0.262 and weighted average of 78.2%, a difference of 4.2%.
In Labor Force | Age 30-34 Correlation Summary
| Measurement | Choctaw | Immigrants from Yemen |
| Minimum | 47.2% | 40.7% |
| Maximum | 100.0% | 100.0% |
| Range | 52.8% | 59.3% |
| Mean | 78.7% | 76.2% |
| Median | 78.9% | 80.0% |
| Interquartile 25% (IQ1) | 72.0% | 65.7% |
| Interquartile 75% (IQ3) | 85.9% | 84.4% |
| Interquartile Range (IQR) | 13.9% | 18.7% |
| Standard Deviation (Sample) | 11.6% | 13.9% |
| Standard Deviation (Population) | 11.5% | 13.8% |
Similar Demographics by In Labor Force | Age 30-34
Demographics Similar to Choctaw by In Labor Force | Age 30-34
In terms of in labor force | age 30-34, the demographic groups most similar to Choctaw are Shoshone (81.4%, a difference of 0.0%), Yaqui (81.4%, a difference of 0.020%), Immigrants from the Azores (81.5%, a difference of 0.080%), Arapaho (81.5%, a difference of 0.080%), and Alaska Native (81.3%, a difference of 0.10%).
| Demographics | Rating | Rank | In Labor Force | Age 30-34 |
| Chickasaw | 0.0 /100 | #311 | Tragic 81.9% |
| Mexicans | 0.0 /100 | #312 | Tragic 81.9% |
| Iroquois | 0.0 /100 | #313 | Tragic 81.9% |
| Alaskan Athabascans | 0.0 /100 | #314 | Tragic 81.7% |
| Cherokee | 0.0 /100 | #315 | Tragic 81.6% |
| Immigrants | Azores | 0.0 /100 | #316 | Tragic 81.5% |
| Arapaho | 0.0 /100 | #317 | Tragic 81.5% |
| Choctaw | 0.0 /100 | #318 | Tragic 81.4% |
| Shoshone | 0.0 /100 | #319 | Tragic 81.4% |
| Yaqui | 0.0 /100 | #320 | Tragic 81.4% |
| Alaska Natives | 0.0 /100 | #321 | Tragic 81.3% |
| Puerto Ricans | 0.0 /100 | #322 | Tragic 81.2% |
| Paiute | 0.0 /100 | #323 | Tragic 81.2% |
| Cheyenne | 0.0 /100 | #324 | Tragic 81.1% |
| Dutch West Indians | 0.0 /100 | #325 | Tragic 81.0% |
Demographics Similar to Immigrants from Yemen by In Labor Force | Age 30-34
In terms of in labor force | age 30-34, the demographic groups most similar to Immigrants from Yemen are Tohono O'odham (77.7%, a difference of 0.57%), Ute (78.9%, a difference of 0.98%), Apache (79.0%, a difference of 1.1%), Pima (79.0%, a difference of 1.1%), and Lumbee (77.3%, a difference of 1.2%).
| Demographics | Rating | Rank | In Labor Force | Age 30-34 |
| Inupiat | 0.0 /100 | #333 | Tragic 79.7% |
| Hopi | 0.0 /100 | #334 | Tragic 79.3% |
| Marshallese | 0.0 /100 | #335 | Tragic 79.2% |
| Natives/Alaskans | 0.0 /100 | #336 | Tragic 79.2% |
| Yakama | 0.0 /100 | #337 | Tragic 79.1% |
| Pima | 0.0 /100 | #338 | Tragic 79.0% |
| Apache | 0.0 /100 | #339 | Tragic 79.0% |
| Ute | 0.0 /100 | #340 | Tragic 78.9% |
| Immigrants | Yemen | 0.0 /100 | #341 | Tragic 78.2% |
| Tohono O'odham | 0.0 /100 | #342 | Tragic 77.7% |
| Lumbee | 0.0 /100 | #343 | Tragic 77.3% |
| Yuman | 0.0 /100 | #344 | Tragic 77.1% |
| Yup'ik | 0.0 /100 | #345 | Tragic 76.4% |
| Crow | 0.0 /100 | #346 | Tragic 75.9% |
| Navajo | 0.0 /100 | #347 | Tragic 73.8% |