Immigrants from Uzbekistan vs Immigrants from Yemen In Labor Force | Age 30-34
COMPARE
Immigrants from Uzbekistan
Immigrants from Yemen
In Labor Force | Age 30-34
In Labor Force | Age 30-34 Comparison
Immigrants from Uzbekistan
Immigrants from Yemen
84.7%
IN LABOR FORCE | AGE 30-34
49.1/ 100
METRIC RATING
176th/ 347
METRIC RANK
78.2%
IN LABOR FORCE | AGE 30-34
0.0/ 100
METRIC RATING
341st/ 347
METRIC RANK
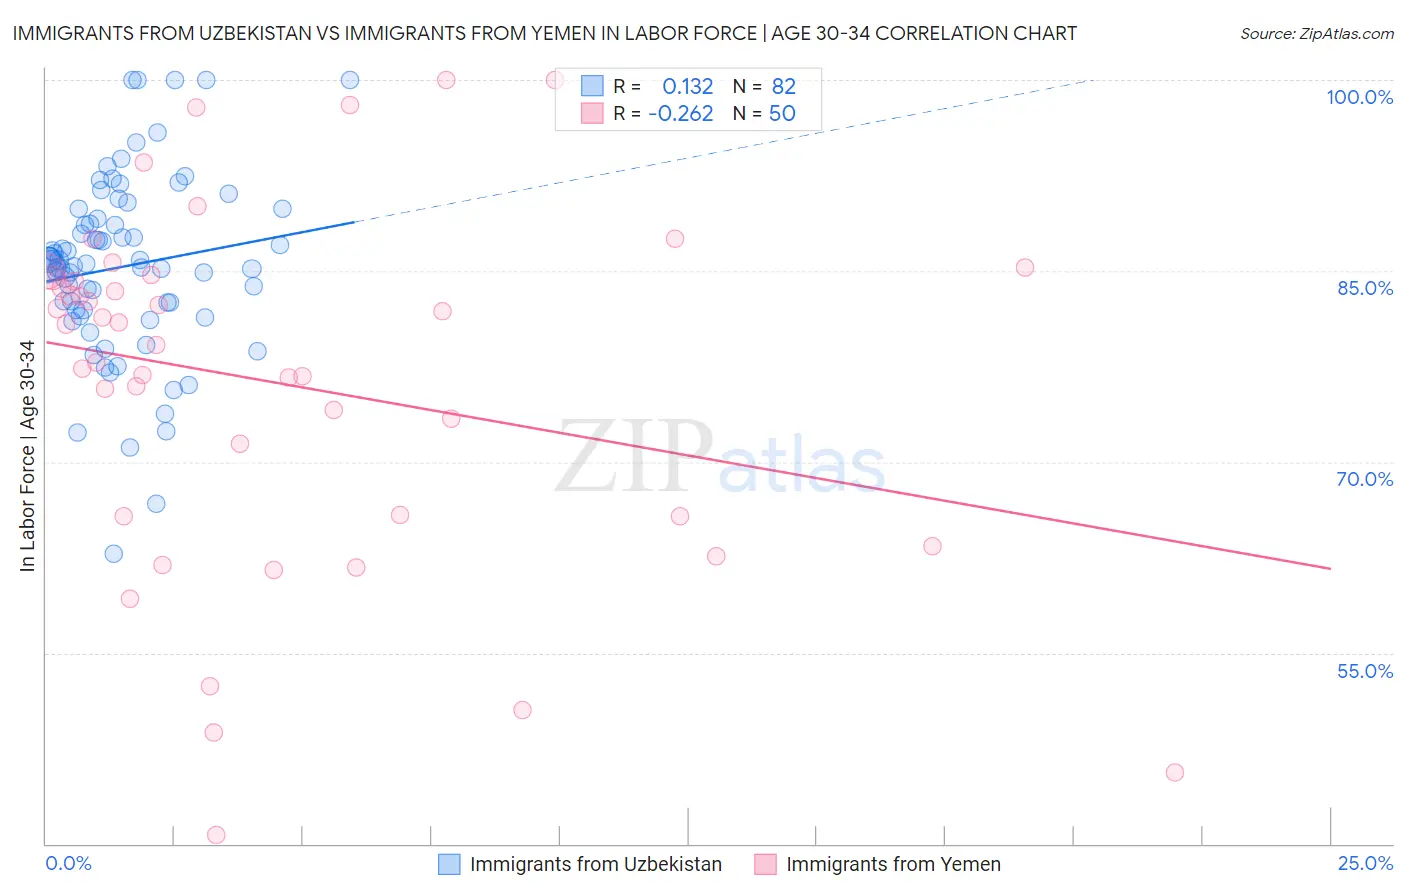
Immigrants from Uzbekistan vs Immigrants from Yemen In Labor Force | Age 30-34 Correlation Chart
The statistical analysis conducted on geographies consisting of 118,740,878 people shows a poor positive correlation between the proportion of Immigrants from Uzbekistan and labor force participation rate among population between the ages 30 and 34 in the United States with a correlation coefficient (R) of 0.132 and weighted average of 84.7%. Similarly, the statistical analysis conducted on geographies consisting of 82,432,494 people shows a weak negative correlation between the proportion of Immigrants from Yemen and labor force participation rate among population between the ages 30 and 34 in the United States with a correlation coefficient (R) of -0.262 and weighted average of 78.2%, a difference of 8.3%.
In Labor Force | Age 30-34 Correlation Summary
| Measurement | Immigrants from Uzbekistan | Immigrants from Yemen |
| Minimum | 62.8% | 40.7% |
| Maximum | 100.0% | 100.0% |
| Range | 37.2% | 59.3% |
| Mean | 85.3% | 76.2% |
| Median | 85.5% | 80.0% |
| Interquartile 25% (IQ1) | 81.9% | 65.7% |
| Interquartile 75% (IQ3) | 89.1% | 84.4% |
| Interquartile Range (IQR) | 7.2% | 18.7% |
| Standard Deviation (Sample) | 7.1% | 13.9% |
| Standard Deviation (Population) | 7.1% | 13.8% |
Similar Demographics by In Labor Force | Age 30-34
Demographics Similar to Immigrants from Uzbekistan by In Labor Force | Age 30-34
In terms of in labor force | age 30-34, the demographic groups most similar to Immigrants from Uzbekistan are Israeli (84.7%, a difference of 0.010%), Finnish (84.7%, a difference of 0.010%), Immigrants from South America (84.7%, a difference of 0.010%), South American Indian (84.7%, a difference of 0.020%), and Immigrants from Burma/Myanmar (84.7%, a difference of 0.020%).
| Demographics | Rating | Rank | In Labor Force | Age 30-34 |
| South American Indians | 52.1 /100 | #169 | Average 84.7% |
| Immigrants | Burma/Myanmar | 52.0 /100 | #170 | Average 84.7% |
| Irish | 52.0 /100 | #171 | Average 84.7% |
| Immigrants | England | 51.7 /100 | #172 | Average 84.7% |
| Israelis | 51.1 /100 | #173 | Average 84.7% |
| Finns | 50.0 /100 | #174 | Average 84.7% |
| Immigrants | South America | 50.0 /100 | #175 | Average 84.7% |
| Immigrants | Uzbekistan | 49.1 /100 | #176 | Average 84.7% |
| Laotians | 46.9 /100 | #177 | Average 84.7% |
| Okinawans | 44.1 /100 | #178 | Average 84.6% |
| Immigrants | Nigeria | 42.5 /100 | #179 | Average 84.6% |
| Immigrants | Netherlands | 42.1 /100 | #180 | Average 84.6% |
| Moroccans | 40.3 /100 | #181 | Average 84.6% |
| Barbadians | 36.7 /100 | #182 | Fair 84.6% |
| Immigrants | Canada | 35.0 /100 | #183 | Fair 84.6% |
Demographics Similar to Immigrants from Yemen by In Labor Force | Age 30-34
In terms of in labor force | age 30-34, the demographic groups most similar to Immigrants from Yemen are Tohono O'odham (77.7%, a difference of 0.57%), Ute (78.9%, a difference of 0.98%), Apache (79.0%, a difference of 1.1%), Pima (79.0%, a difference of 1.1%), and Lumbee (77.3%, a difference of 1.2%).
| Demographics | Rating | Rank | In Labor Force | Age 30-34 |
| Inupiat | 0.0 /100 | #333 | Tragic 79.7% |
| Hopi | 0.0 /100 | #334 | Tragic 79.3% |
| Marshallese | 0.0 /100 | #335 | Tragic 79.2% |
| Natives/Alaskans | 0.0 /100 | #336 | Tragic 79.2% |
| Yakama | 0.0 /100 | #337 | Tragic 79.1% |
| Pima | 0.0 /100 | #338 | Tragic 79.0% |
| Apache | 0.0 /100 | #339 | Tragic 79.0% |
| Ute | 0.0 /100 | #340 | Tragic 78.9% |
| Immigrants | Yemen | 0.0 /100 | #341 | Tragic 78.2% |
| Tohono O'odham | 0.0 /100 | #342 | Tragic 77.7% |
| Lumbee | 0.0 /100 | #343 | Tragic 77.3% |
| Yuman | 0.0 /100 | #344 | Tragic 77.1% |
| Yup'ik | 0.0 /100 | #345 | Tragic 76.4% |
| Crow | 0.0 /100 | #346 | Tragic 75.9% |
| Navajo | 0.0 /100 | #347 | Tragic 73.8% |