Polish vs Immigrants from Yemen In Labor Force | Age 30-34
COMPARE
Polish
Immigrants from Yemen
In Labor Force | Age 30-34
In Labor Force | Age 30-34 Comparison
Poles
Immigrants from Yemen
85.5%
IN LABOR FORCE | AGE 30-34
99.6/ 100
METRIC RATING
58th/ 347
METRIC RANK
78.2%
IN LABOR FORCE | AGE 30-34
0.0/ 100
METRIC RATING
341st/ 347
METRIC RANK
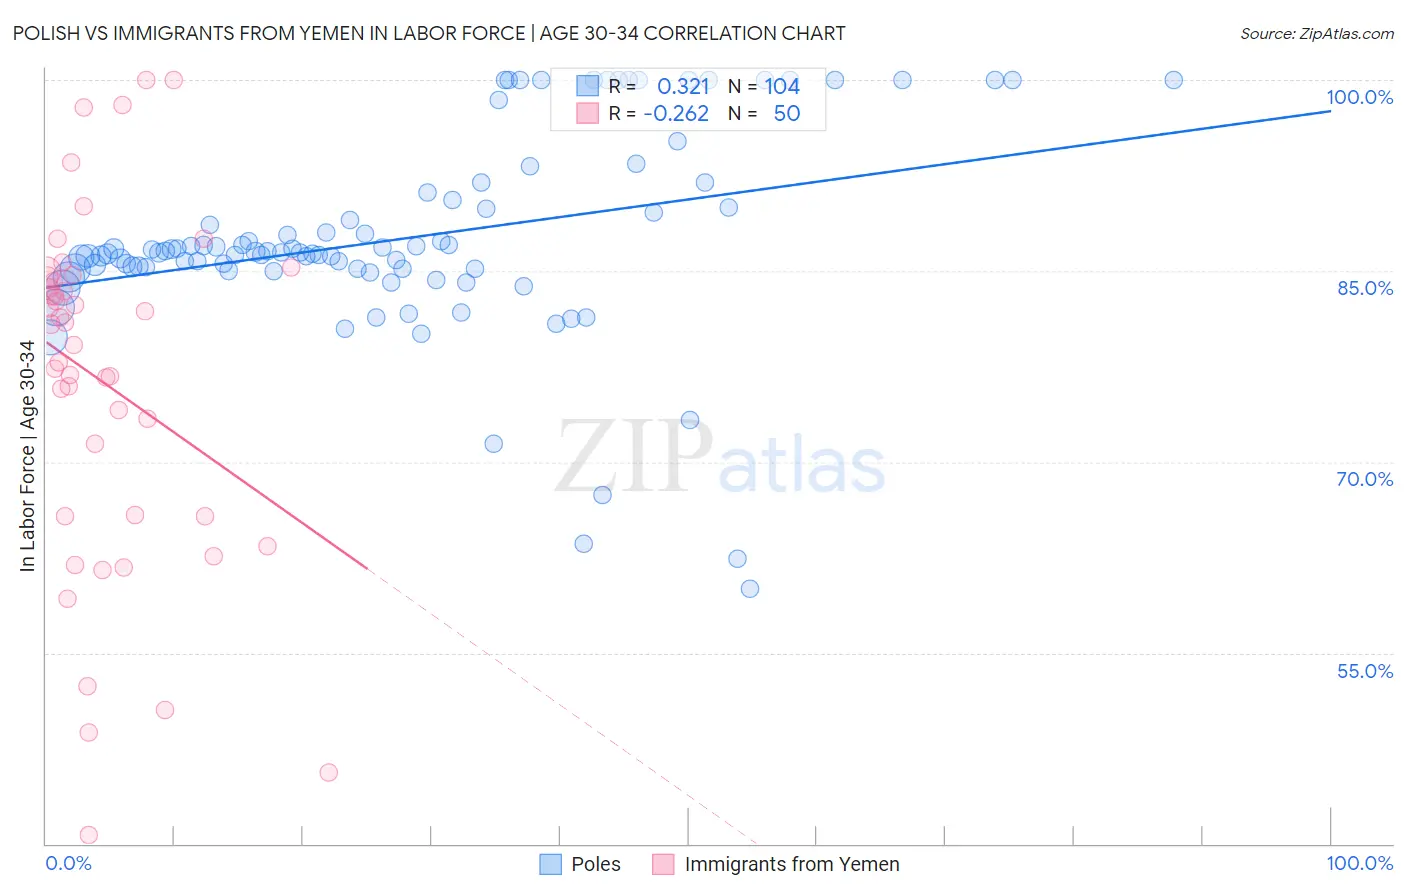
Polish vs Immigrants from Yemen In Labor Force | Age 30-34 Correlation Chart
The statistical analysis conducted on geographies consisting of 559,395,237 people shows a mild positive correlation between the proportion of Poles and labor force participation rate among population between the ages 30 and 34 in the United States with a correlation coefficient (R) of 0.321 and weighted average of 85.5%. Similarly, the statistical analysis conducted on geographies consisting of 82,432,494 people shows a weak negative correlation between the proportion of Immigrants from Yemen and labor force participation rate among population between the ages 30 and 34 in the United States with a correlation coefficient (R) of -0.262 and weighted average of 78.2%, a difference of 9.4%.
In Labor Force | Age 30-34 Correlation Summary
| Measurement | Polish | Immigrants from Yemen |
| Minimum | 60.0% | 40.7% |
| Maximum | 100.0% | 100.0% |
| Range | 40.0% | 59.3% |
| Mean | 87.5% | 76.2% |
| Median | 86.5% | 80.0% |
| Interquartile 25% (IQ1) | 85.2% | 65.7% |
| Interquartile 75% (IQ3) | 90.3% | 84.4% |
| Interquartile Range (IQR) | 5.1% | 18.7% |
| Standard Deviation (Sample) | 8.0% | 13.9% |
| Standard Deviation (Population) | 7.9% | 13.8% |
Similar Demographics by In Labor Force | Age 30-34
Demographics Similar to Poles by In Labor Force | Age 30-34
In terms of in labor force | age 30-34, the demographic groups most similar to Poles are Russian (85.5%, a difference of 0.0%), Immigrants from Turkey (85.5%, a difference of 0.010%), Czech (85.5%, a difference of 0.010%), Immigrants from Poland (85.5%, a difference of 0.010%), and Immigrants from Kenya (85.5%, a difference of 0.020%).
| Demographics | Rating | Rank | In Labor Force | Age 30-34 |
| Cape Verdeans | 99.7 /100 | #51 | Exceptional 85.6% |
| Slovenes | 99.7 /100 | #52 | Exceptional 85.6% |
| Filipinos | 99.6 /100 | #53 | Exceptional 85.5% |
| Immigrants | Kenya | 99.6 /100 | #54 | Exceptional 85.5% |
| Immigrants | Turkey | 99.6 /100 | #55 | Exceptional 85.5% |
| Czechs | 99.6 /100 | #56 | Exceptional 85.5% |
| Russians | 99.6 /100 | #57 | Exceptional 85.5% |
| Poles | 99.6 /100 | #58 | Exceptional 85.5% |
| Immigrants | Poland | 99.5 /100 | #59 | Exceptional 85.5% |
| Immigrants | France | 99.5 /100 | #60 | Exceptional 85.5% |
| Immigrants | Brazil | 99.5 /100 | #61 | Exceptional 85.5% |
| Soviet Union | 99.4 /100 | #62 | Exceptional 85.5% |
| Macedonians | 99.4 /100 | #63 | Exceptional 85.5% |
| Italians | 99.4 /100 | #64 | Exceptional 85.4% |
| Senegalese | 99.4 /100 | #65 | Exceptional 85.4% |
Demographics Similar to Immigrants from Yemen by In Labor Force | Age 30-34
In terms of in labor force | age 30-34, the demographic groups most similar to Immigrants from Yemen are Tohono O'odham (77.7%, a difference of 0.57%), Ute (78.9%, a difference of 0.98%), Apache (79.0%, a difference of 1.1%), Pima (79.0%, a difference of 1.1%), and Lumbee (77.3%, a difference of 1.2%).
| Demographics | Rating | Rank | In Labor Force | Age 30-34 |
| Inupiat | 0.0 /100 | #333 | Tragic 79.7% |
| Hopi | 0.0 /100 | #334 | Tragic 79.3% |
| Marshallese | 0.0 /100 | #335 | Tragic 79.2% |
| Natives/Alaskans | 0.0 /100 | #336 | Tragic 79.2% |
| Yakama | 0.0 /100 | #337 | Tragic 79.1% |
| Pima | 0.0 /100 | #338 | Tragic 79.0% |
| Apache | 0.0 /100 | #339 | Tragic 79.0% |
| Ute | 0.0 /100 | #340 | Tragic 78.9% |
| Immigrants | Yemen | 0.0 /100 | #341 | Tragic 78.2% |
| Tohono O'odham | 0.0 /100 | #342 | Tragic 77.7% |
| Lumbee | 0.0 /100 | #343 | Tragic 77.3% |
| Yuman | 0.0 /100 | #344 | Tragic 77.1% |
| Yup'ik | 0.0 /100 | #345 | Tragic 76.4% |
| Crow | 0.0 /100 | #346 | Tragic 75.9% |
| Navajo | 0.0 /100 | #347 | Tragic 73.8% |