Turkish vs Venezuelan In Labor Force | Age 30-34
COMPARE
Turkish
Venezuelan
In Labor Force | Age 30-34
In Labor Force | Age 30-34 Comparison
Turks
Venezuelans
85.7%
IN LABOR FORCE | AGE 30-34
99.9/ 100
METRIC RATING
40th/ 347
METRIC RANK
84.0%
IN LABOR FORCE | AGE 30-34
1.3/ 100
METRIC RATING
240th/ 347
METRIC RANK
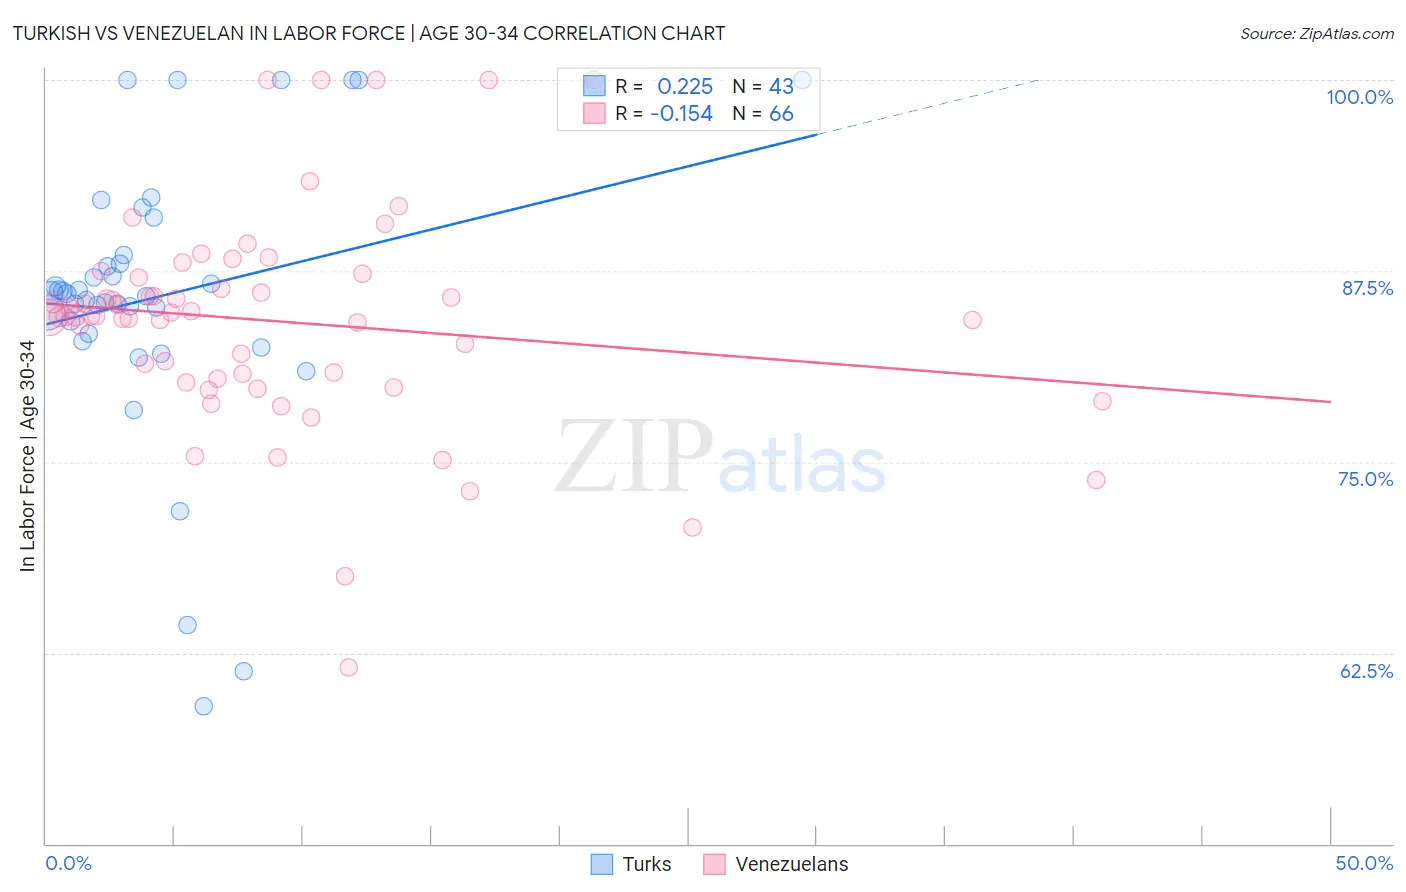
Turkish vs Venezuelan In Labor Force | Age 30-34 Correlation Chart
The statistical analysis conducted on geographies consisting of 271,716,340 people shows a weak positive correlation between the proportion of Turks and labor force participation rate among population between the ages 30 and 34 in the United States with a correlation coefficient (R) of 0.225 and weighted average of 85.7%. Similarly, the statistical analysis conducted on geographies consisting of 306,199,344 people shows a poor negative correlation between the proportion of Venezuelans and labor force participation rate among population between the ages 30 and 34 in the United States with a correlation coefficient (R) of -0.154 and weighted average of 84.0%, a difference of 1.9%.
In Labor Force | Age 30-34 Correlation Summary
| Measurement | Turkish | Venezuelan |
| Minimum | 59.0% | 61.5% |
| Maximum | 100.0% | 100.0% |
| Range | 41.0% | 38.5% |
| Mean | 85.8% | 84.2% |
| Median | 86.0% | 84.5% |
| Interquartile 25% (IQ1) | 83.4% | 80.5% |
| Interquartile 75% (IQ3) | 88.6% | 87.1% |
| Interquartile Range (IQR) | 5.1% | 6.6% |
| Standard Deviation (Sample) | 9.1% | 7.2% |
| Standard Deviation (Population) | 9.0% | 7.1% |
Similar Demographics by In Labor Force | Age 30-34
Demographics Similar to Turks by In Labor Force | Age 30-34
In terms of in labor force | age 30-34, the demographic groups most similar to Turks are Immigrants from Italy (85.7%, a difference of 0.030%), Zimbabwean (85.6%, a difference of 0.030%), Eastern European (85.7%, a difference of 0.040%), Immigrants from Lithuania (85.6%, a difference of 0.040%), and Immigrants from Sri Lanka (85.6%, a difference of 0.060%).
| Demographics | Rating | Rank | In Labor Force | Age 30-34 |
| Immigrants | Bosnia and Herzegovina | 99.9 /100 | #33 | Exceptional 85.8% |
| Ugandans | 99.9 /100 | #34 | Exceptional 85.8% |
| Serbians | 99.9 /100 | #35 | Exceptional 85.8% |
| Albanians | 99.9 /100 | #36 | Exceptional 85.7% |
| Norwegians | 99.9 /100 | #37 | Exceptional 85.7% |
| Immigrants | Greece | 99.9 /100 | #38 | Exceptional 85.7% |
| Eastern Europeans | 99.9 /100 | #39 | Exceptional 85.7% |
| Turks | 99.9 /100 | #40 | Exceptional 85.7% |
| Immigrants | Italy | 99.9 /100 | #41 | Exceptional 85.7% |
| Zimbabweans | 99.8 /100 | #42 | Exceptional 85.6% |
| Immigrants | Lithuania | 99.8 /100 | #43 | Exceptional 85.6% |
| Immigrants | Sri Lanka | 99.8 /100 | #44 | Exceptional 85.6% |
| Immigrants | Nepal | 99.8 /100 | #45 | Exceptional 85.6% |
| Immigrants | Morocco | 99.8 /100 | #46 | Exceptional 85.6% |
| Croatians | 99.8 /100 | #47 | Exceptional 85.6% |
Demographics Similar to Venezuelans by In Labor Force | Age 30-34
In terms of in labor force | age 30-34, the demographic groups most similar to Venezuelans are English (84.0%, a difference of 0.0%), Celtic (84.1%, a difference of 0.010%), Immigrants from Barbados (84.0%, a difference of 0.010%), U.S. Virgin Islander (84.1%, a difference of 0.020%), and Immigrants from Portugal (84.0%, a difference of 0.020%).
| Demographics | Rating | Rank | In Labor Force | Age 30-34 |
| West Indians | 1.9 /100 | #233 | Tragic 84.1% |
| Haitians | 1.8 /100 | #234 | Tragic 84.1% |
| French American Indians | 1.7 /100 | #235 | Tragic 84.1% |
| U.S. Virgin Islanders | 1.5 /100 | #236 | Tragic 84.1% |
| Celtics | 1.4 /100 | #237 | Tragic 84.1% |
| Immigrants | Barbados | 1.4 /100 | #238 | Tragic 84.0% |
| English | 1.4 /100 | #239 | Tragic 84.0% |
| Venezuelans | 1.3 /100 | #240 | Tragic 84.0% |
| Immigrants | Portugal | 1.2 /100 | #241 | Tragic 84.0% |
| Immigrants | Oceania | 1.1 /100 | #242 | Tragic 84.0% |
| Immigrants | Caribbean | 1.1 /100 | #243 | Tragic 84.0% |
| Basques | 0.9 /100 | #244 | Tragic 84.0% |
| Immigrants | Venezuela | 0.9 /100 | #245 | Tragic 84.0% |
| Central Americans | 0.9 /100 | #246 | Tragic 84.0% |
| British West Indians | 0.8 /100 | #247 | Tragic 84.0% |