Lumbee vs Immigrants from Netherlands In Labor Force | Age 30-34
COMPARE
Lumbee
Immigrants from Netherlands
In Labor Force | Age 30-34
In Labor Force | Age 30-34 Comparison
Lumbee
Immigrants from Netherlands
77.3%
IN LABOR FORCE | AGE 30-34
0.0/ 100
METRIC RATING
343rd/ 347
METRIC RANK
84.6%
IN LABOR FORCE | AGE 30-34
42.1/ 100
METRIC RATING
180th/ 347
METRIC RANK
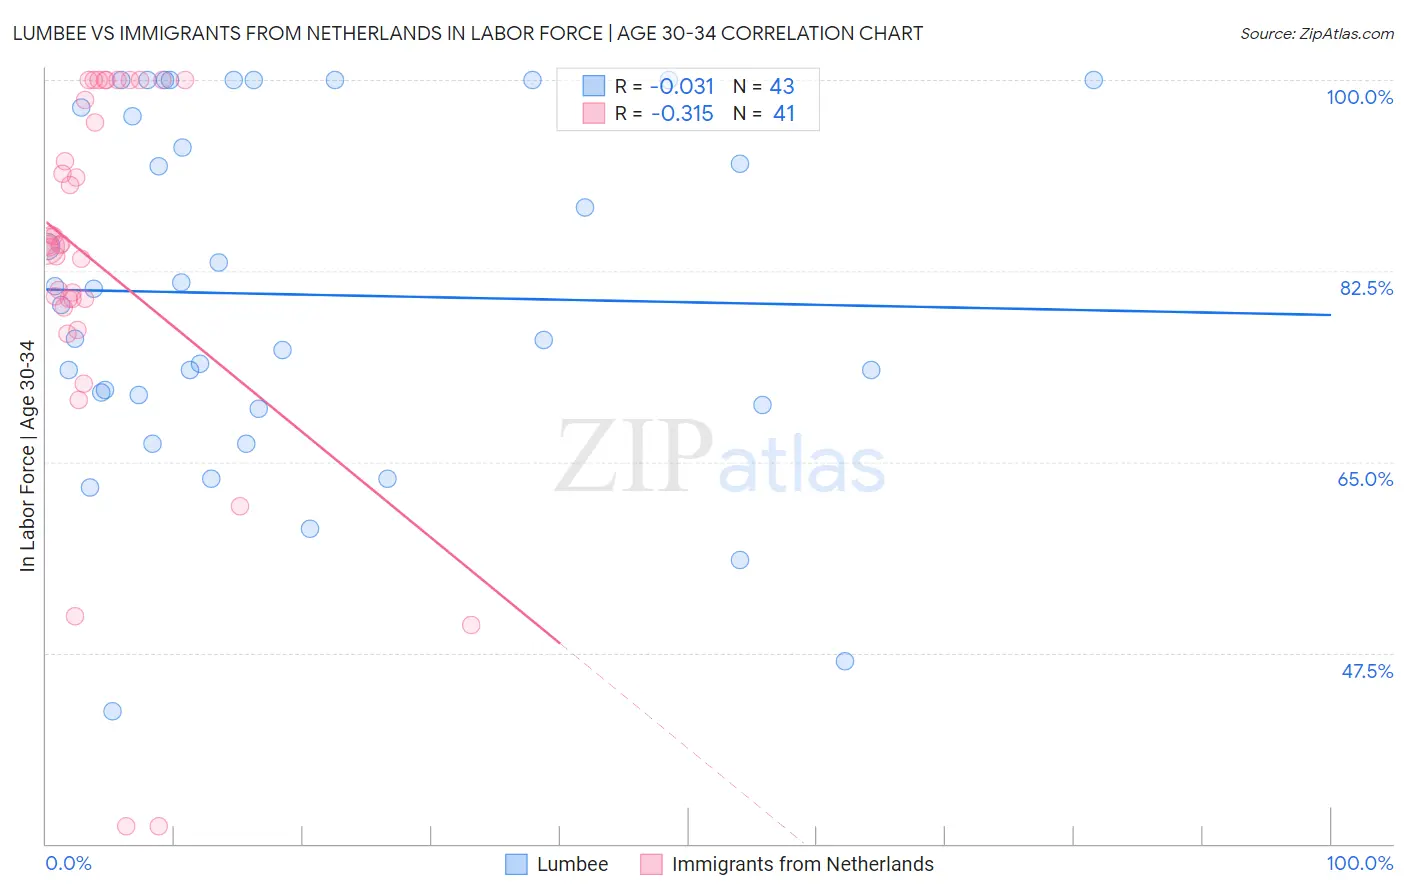
Lumbee vs Immigrants from Netherlands In Labor Force | Age 30-34 Correlation Chart
The statistical analysis conducted on geographies consisting of 92,256,461 people shows no correlation between the proportion of Lumbee and labor force participation rate among population between the ages 30 and 34 in the United States with a correlation coefficient (R) of -0.031 and weighted average of 77.3%. Similarly, the statistical analysis conducted on geographies consisting of 237,758,588 people shows a mild negative correlation between the proportion of Immigrants from Netherlands and labor force participation rate among population between the ages 30 and 34 in the United States with a correlation coefficient (R) of -0.315 and weighted average of 84.6%, a difference of 9.5%.
In Labor Force | Age 30-34 Correlation Summary
| Measurement | Lumbee | Immigrants from Netherlands |
| Minimum | 42.1% | 31.6% |
| Maximum | 100.0% | 100.0% |
| Range | 57.9% | 68.4% |
| Mean | 80.3% | 83.0% |
| Median | 79.4% | 84.9% |
| Interquartile 25% (IQ1) | 70.2% | 79.5% |
| Interquartile 75% (IQ3) | 97.5% | 99.1% |
| Interquartile Range (IQR) | 27.2% | 19.5% |
| Standard Deviation (Sample) | 15.9% | 17.2% |
| Standard Deviation (Population) | 15.7% | 17.0% |
Similar Demographics by In Labor Force | Age 30-34
Demographics Similar to Lumbee by In Labor Force | Age 30-34
In terms of in labor force | age 30-34, the demographic groups most similar to Lumbee are Yuman (77.1%, a difference of 0.23%), Tohono O'odham (77.7%, a difference of 0.60%), Yup'ik (76.4%, a difference of 1.1%), Immigrants from Yemen (78.2%, a difference of 1.2%), and Crow (75.9%, a difference of 1.8%).
| Demographics | Rating | Rank | In Labor Force | Age 30-34 |
| Inupiat | 0.0 /100 | #333 | Tragic 79.7% |
| Hopi | 0.0 /100 | #334 | Tragic 79.3% |
| Marshallese | 0.0 /100 | #335 | Tragic 79.2% |
| Natives/Alaskans | 0.0 /100 | #336 | Tragic 79.2% |
| Yakama | 0.0 /100 | #337 | Tragic 79.1% |
| Pima | 0.0 /100 | #338 | Tragic 79.0% |
| Apache | 0.0 /100 | #339 | Tragic 79.0% |
| Ute | 0.0 /100 | #340 | Tragic 78.9% |
| Immigrants | Yemen | 0.0 /100 | #341 | Tragic 78.2% |
| Tohono O'odham | 0.0 /100 | #342 | Tragic 77.7% |
| Lumbee | 0.0 /100 | #343 | Tragic 77.3% |
| Yuman | 0.0 /100 | #344 | Tragic 77.1% |
| Yup'ik | 0.0 /100 | #345 | Tragic 76.4% |
| Crow | 0.0 /100 | #346 | Tragic 75.9% |
| Navajo | 0.0 /100 | #347 | Tragic 73.8% |
Demographics Similar to Immigrants from Netherlands by In Labor Force | Age 30-34
In terms of in labor force | age 30-34, the demographic groups most similar to Immigrants from Netherlands are Immigrants from Nigeria (84.6%, a difference of 0.0%), Okinawan (84.6%, a difference of 0.010%), Moroccan (84.6%, a difference of 0.010%), Laotian (84.7%, a difference of 0.030%), and Barbadian (84.6%, a difference of 0.040%).
| Demographics | Rating | Rank | In Labor Force | Age 30-34 |
| Israelis | 51.1 /100 | #173 | Average 84.7% |
| Finns | 50.0 /100 | #174 | Average 84.7% |
| Immigrants | South America | 50.0 /100 | #175 | Average 84.7% |
| Immigrants | Uzbekistan | 49.1 /100 | #176 | Average 84.7% |
| Laotians | 46.9 /100 | #177 | Average 84.7% |
| Okinawans | 44.1 /100 | #178 | Average 84.6% |
| Immigrants | Nigeria | 42.5 /100 | #179 | Average 84.6% |
| Immigrants | Netherlands | 42.1 /100 | #180 | Average 84.6% |
| Moroccans | 40.3 /100 | #181 | Average 84.6% |
| Barbadians | 36.7 /100 | #182 | Fair 84.6% |
| Immigrants | Canada | 35.0 /100 | #183 | Fair 84.6% |
| Immigrants | North America | 33.3 /100 | #184 | Fair 84.6% |
| Immigrants | Philippines | 31.5 /100 | #185 | Fair 84.6% |
| Immigrants | Congo | 29.7 /100 | #186 | Fair 84.6% |
| Costa Ricans | 29.6 /100 | #187 | Fair 84.6% |