Immigrants from Sweden vs Immigrants from Hungary In Labor Force | Age 16-19
COMPARE
Immigrants from Sweden
Immigrants from Hungary
In Labor Force | Age 16-19
In Labor Force | Age 16-19 Comparison
Immigrants from Sweden
Immigrants from Hungary
35.9%
IN LABOR FORCE | AGE 16-19
18.8/ 100
METRIC RATING
200th/ 347
METRIC RANK
36.2%
IN LABOR FORCE | AGE 16-19
28.8/ 100
METRIC RATING
189th/ 347
METRIC RANK
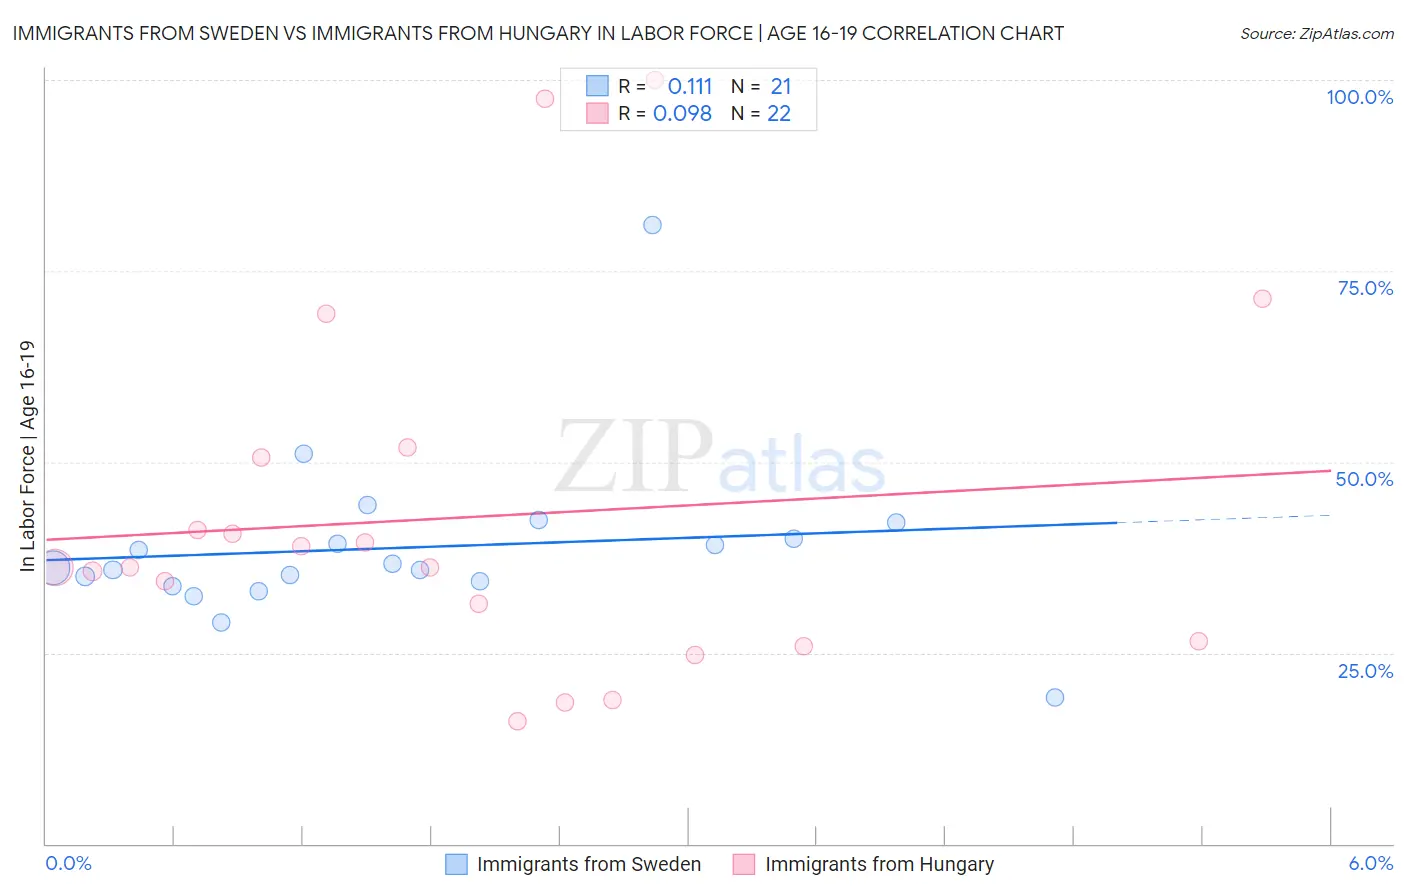
Immigrants from Sweden vs Immigrants from Hungary In Labor Force | Age 16-19 Correlation Chart
The statistical analysis conducted on geographies consisting of 164,543,738 people shows a poor positive correlation between the proportion of Immigrants from Sweden and labor force participation rate among population between the ages 16 and 19 in the United States with a correlation coefficient (R) of 0.111 and weighted average of 35.9%. Similarly, the statistical analysis conducted on geographies consisting of 195,472,897 people shows a slight positive correlation between the proportion of Immigrants from Hungary and labor force participation rate among population between the ages 16 and 19 in the United States with a correlation coefficient (R) of 0.098 and weighted average of 36.2%, a difference of 0.71%.
In Labor Force | Age 16-19 Correlation Summary
| Measurement | Immigrants from Sweden | Immigrants from Hungary |
| Minimum | 19.1% | 16.1% |
| Maximum | 81.0% | 100.0% |
| Range | 61.9% | 83.9% |
| Mean | 38.8% | 42.8% |
| Median | 36.1% | 36.2% |
| Interquartile 25% (IQ1) | 34.0% | 26.5% |
| Interquartile 75% (IQ3) | 41.0% | 50.5% |
| Interquartile Range (IQR) | 7.0% | 24.0% |
| Standard Deviation (Sample) | 11.5% | 23.0% |
| Standard Deviation (Population) | 11.2% | 22.5% |
Demographics Similar to Immigrants from Sweden and Immigrants from Hungary by In Labor Force | Age 16-19
In terms of in labor force | age 16-19, the demographic groups most similar to Immigrants from Sweden are Immigrants from Norway (35.9%, a difference of 0.080%), Immigrants from Northern Africa (35.9%, a difference of 0.090%), Alsatian (35.9%, a difference of 0.12%), Senegalese (35.9%, a difference of 0.12%), and Immigrants from Serbia (36.0%, a difference of 0.17%). Similarly, the demographic groups most similar to Immigrants from Hungary are Panamanian (36.1%, a difference of 0.010%), Immigrants from Croatia (36.1%, a difference of 0.080%), Immigrants from Europe (36.2%, a difference of 0.18%), Afghan (36.1%, a difference of 0.20%), and Immigrants from Denmark (36.1%, a difference of 0.25%).
| Demographics | Rating | Rank | In Labor Force | Age 16-19 |
| Costa Ricans | 36.1 /100 | #184 | Fair 36.3% |
| Bhutanese | 35.3 /100 | #185 | Fair 36.3% |
| Immigrants | Romania | 34.0 /100 | #186 | Fair 36.3% |
| Immigrants | Afghanistan | 34.0 /100 | #187 | Fair 36.3% |
| Immigrants | Europe | 31.8 /100 | #188 | Fair 36.2% |
| Immigrants | Hungary | 28.8 /100 | #189 | Fair 36.2% |
| Panamanians | 28.6 /100 | #190 | Fair 36.1% |
| Immigrants | Croatia | 27.5 /100 | #191 | Fair 36.1% |
| Afghans | 25.7 /100 | #192 | Fair 36.1% |
| Immigrants | Denmark | 25.0 /100 | #193 | Fair 36.1% |
| Nigerians | 24.6 /100 | #194 | Fair 36.1% |
| Bolivians | 23.3 /100 | #195 | Fair 36.0% |
| Mexican American Indians | 21.1 /100 | #196 | Fair 36.0% |
| Immigrants | Serbia | 21.0 /100 | #197 | Fair 36.0% |
| Immigrants | Northern Africa | 19.9 /100 | #198 | Poor 35.9% |
| Immigrants | Norway | 19.8 /100 | #199 | Poor 35.9% |
| Immigrants | Sweden | 18.8 /100 | #200 | Poor 35.9% |
| Alsatians | 17.5 /100 | #201 | Poor 35.9% |
| Senegalese | 17.4 /100 | #202 | Poor 35.9% |
| Immigrants | Nigeria | 16.8 /100 | #203 | Poor 35.8% |
| Immigrants | Albania | 15.0 /100 | #204 | Poor 35.8% |