Immigrants from Spain vs Immigrants from Hungary In Labor Force | Age 16-19
COMPARE
Immigrants from Spain
Immigrants from Hungary
In Labor Force | Age 16-19
In Labor Force | Age 16-19 Comparison
Immigrants from Spain
Immigrants from Hungary
33.7%
IN LABOR FORCE | AGE 16-19
0.2/ 100
METRIC RATING
284th/ 347
METRIC RANK
36.2%
IN LABOR FORCE | AGE 16-19
28.8/ 100
METRIC RATING
189th/ 347
METRIC RANK
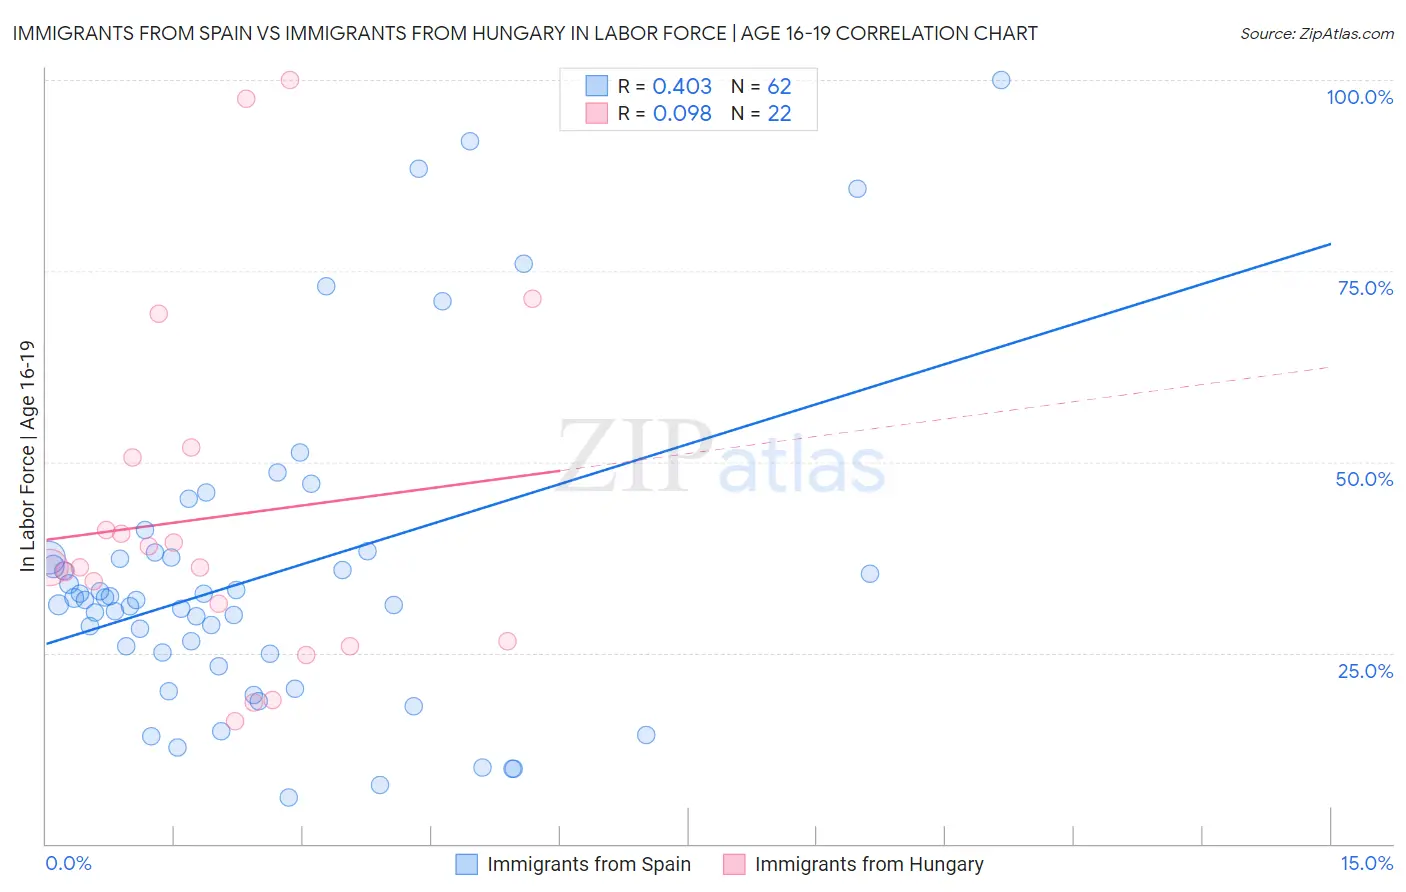
Immigrants from Spain vs Immigrants from Hungary In Labor Force | Age 16-19 Correlation Chart
The statistical analysis conducted on geographies consisting of 239,401,400 people shows a moderate positive correlation between the proportion of Immigrants from Spain and labor force participation rate among population between the ages 16 and 19 in the United States with a correlation coefficient (R) of 0.403 and weighted average of 33.7%. Similarly, the statistical analysis conducted on geographies consisting of 195,472,897 people shows a slight positive correlation between the proportion of Immigrants from Hungary and labor force participation rate among population between the ages 16 and 19 in the United States with a correlation coefficient (R) of 0.098 and weighted average of 36.2%, a difference of 7.3%.
In Labor Force | Age 16-19 Correlation Summary
| Measurement | Immigrants from Spain | Immigrants from Hungary |
| Minimum | 6.1% | 16.1% |
| Maximum | 100.0% | 100.0% |
| Range | 93.9% | 83.9% |
| Mean | 35.1% | 42.8% |
| Median | 31.9% | 36.2% |
| Interquartile 25% (IQ1) | 24.8% | 26.5% |
| Interquartile 75% (IQ3) | 37.5% | 50.5% |
| Interquartile Range (IQR) | 12.7% | 24.0% |
| Standard Deviation (Sample) | 20.5% | 23.0% |
| Standard Deviation (Population) | 20.3% | 22.5% |
Similar Demographics by In Labor Force | Age 16-19
Demographics Similar to Immigrants from Spain by In Labor Force | Age 16-19
In terms of in labor force | age 16-19, the demographic groups most similar to Immigrants from Spain are Immigrants from Venezuela (33.7%, a difference of 0.060%), U.S. Virgin Islander (33.6%, a difference of 0.19%), South American (33.6%, a difference of 0.27%), Immigrants from Korea (33.8%, a difference of 0.41%), and Cypriot (33.8%, a difference of 0.42%).
| Demographics | Rating | Rank | In Labor Force | Age 16-19 |
| Menominee | 0.3 /100 | #277 | Tragic 33.9% |
| Colombians | 0.3 /100 | #278 | Tragic 33.8% |
| Paraguayans | 0.3 /100 | #279 | Tragic 33.8% |
| Taiwanese | 0.3 /100 | #280 | Tragic 33.8% |
| Cypriots | 0.3 /100 | #281 | Tragic 33.8% |
| Immigrants | Korea | 0.3 /100 | #282 | Tragic 33.8% |
| Immigrants | Venezuela | 0.2 /100 | #283 | Tragic 33.7% |
| Immigrants | Spain | 0.2 /100 | #284 | Tragic 33.7% |
| U.S. Virgin Islanders | 0.2 /100 | #285 | Tragic 33.6% |
| South Americans | 0.2 /100 | #286 | Tragic 33.6% |
| Nepalese | 0.1 /100 | #287 | Tragic 33.5% |
| Immigrants | Indonesia | 0.1 /100 | #288 | Tragic 33.5% |
| Immigrants | Singapore | 0.1 /100 | #289 | Tragic 33.5% |
| Immigrants | Colombia | 0.1 /100 | #290 | Tragic 33.5% |
| Immigrants | Belarus | 0.1 /100 | #291 | Tragic 33.4% |
Demographics Similar to Immigrants from Hungary by In Labor Force | Age 16-19
In terms of in labor force | age 16-19, the demographic groups most similar to Immigrants from Hungary are Panamanian (36.1%, a difference of 0.010%), Immigrants from Croatia (36.1%, a difference of 0.080%), Immigrants from Europe (36.2%, a difference of 0.18%), Afghan (36.1%, a difference of 0.20%), and Immigrants from Denmark (36.1%, a difference of 0.25%).
| Demographics | Rating | Rank | In Labor Force | Age 16-19 |
| Immigrants | Italy | 39.1 /100 | #182 | Fair 36.4% |
| Eastern Europeans | 38.8 /100 | #183 | Fair 36.4% |
| Costa Ricans | 36.1 /100 | #184 | Fair 36.3% |
| Bhutanese | 35.3 /100 | #185 | Fair 36.3% |
| Immigrants | Romania | 34.0 /100 | #186 | Fair 36.3% |
| Immigrants | Afghanistan | 34.0 /100 | #187 | Fair 36.3% |
| Immigrants | Europe | 31.8 /100 | #188 | Fair 36.2% |
| Immigrants | Hungary | 28.8 /100 | #189 | Fair 36.2% |
| Panamanians | 28.6 /100 | #190 | Fair 36.1% |
| Immigrants | Croatia | 27.5 /100 | #191 | Fair 36.1% |
| Afghans | 25.7 /100 | #192 | Fair 36.1% |
| Immigrants | Denmark | 25.0 /100 | #193 | Fair 36.1% |
| Nigerians | 24.6 /100 | #194 | Fair 36.1% |
| Bolivians | 23.3 /100 | #195 | Fair 36.0% |
| Mexican American Indians | 21.1 /100 | #196 | Fair 36.0% |