Iranian vs Immigrants from Hungary In Labor Force | Age 16-19
COMPARE
Iranian
Immigrants from Hungary
In Labor Force | Age 16-19
In Labor Force | Age 16-19 Comparison
Iranians
Immigrants from Hungary
33.0%
IN LABOR FORCE | AGE 16-19
0.0/ 100
METRIC RATING
298th/ 347
METRIC RANK
36.2%
IN LABOR FORCE | AGE 16-19
28.8/ 100
METRIC RATING
189th/ 347
METRIC RANK
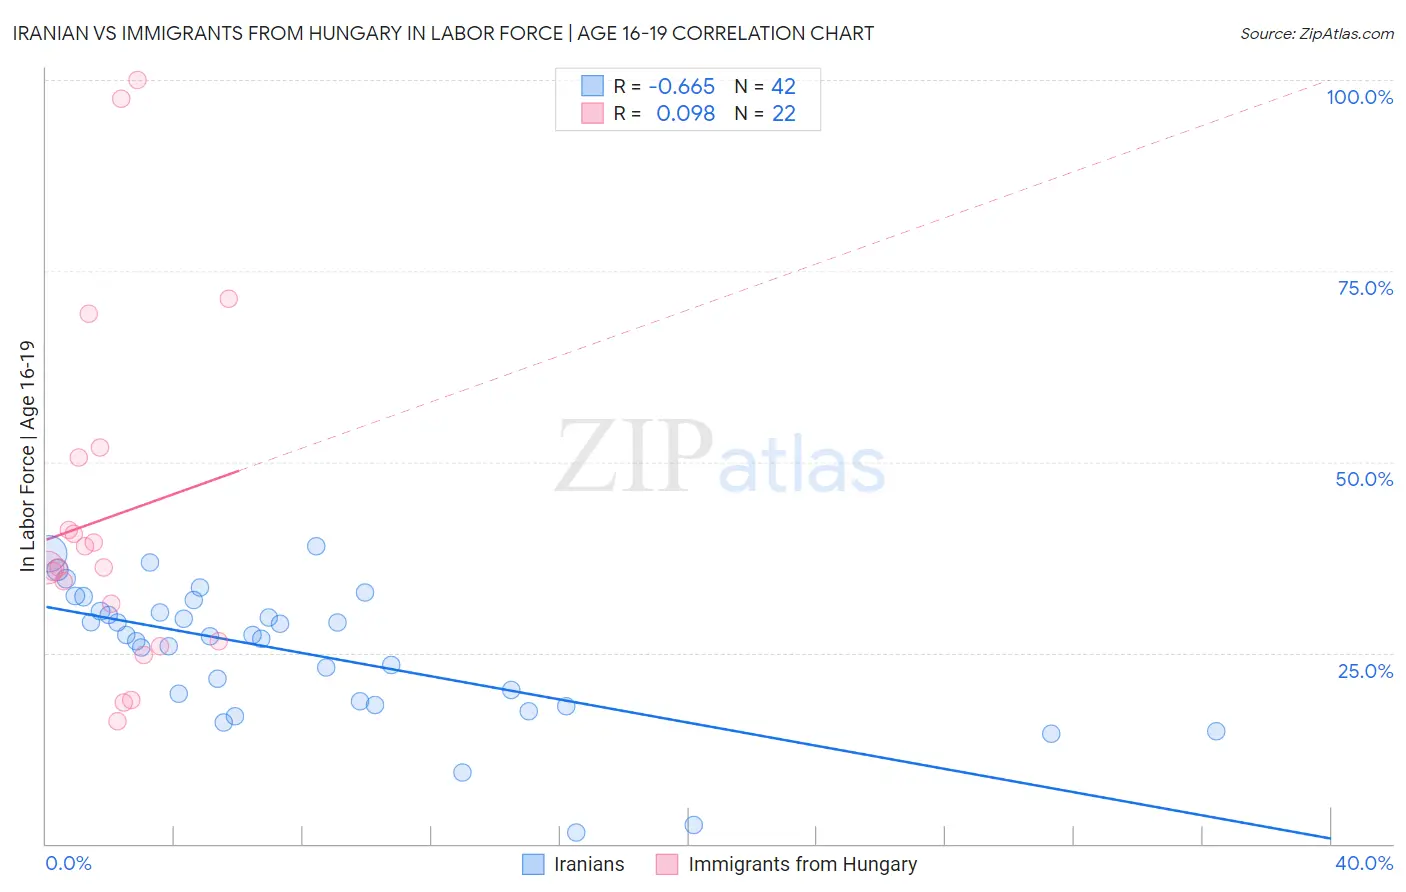
Iranian vs Immigrants from Hungary In Labor Force | Age 16-19 Correlation Chart
The statistical analysis conducted on geographies consisting of 316,490,712 people shows a significant negative correlation between the proportion of Iranians and labor force participation rate among population between the ages 16 and 19 in the United States with a correlation coefficient (R) of -0.665 and weighted average of 33.0%. Similarly, the statistical analysis conducted on geographies consisting of 195,472,897 people shows a slight positive correlation between the proportion of Immigrants from Hungary and labor force participation rate among population between the ages 16 and 19 in the United States with a correlation coefficient (R) of 0.098 and weighted average of 36.2%, a difference of 9.5%.
In Labor Force | Age 16-19 Correlation Summary
| Measurement | Iranian | Immigrants from Hungary |
| Minimum | 1.4% | 16.1% |
| Maximum | 39.0% | 100.0% |
| Range | 37.6% | 83.9% |
| Mean | 25.1% | 42.8% |
| Median | 27.2% | 36.2% |
| Interquartile 25% (IQ1) | 18.6% | 26.5% |
| Interquartile 75% (IQ3) | 30.5% | 50.5% |
| Interquartile Range (IQR) | 11.9% | 24.0% |
| Standard Deviation (Sample) | 8.8% | 23.0% |
| Standard Deviation (Population) | 8.7% | 22.5% |
Similar Demographics by In Labor Force | Age 16-19
Demographics Similar to Iranians by In Labor Force | Age 16-19
In terms of in labor force | age 16-19, the demographic groups most similar to Iranians are Armenian (32.9%, a difference of 0.24%), Immigrants from Argentina (32.9%, a difference of 0.40%), Immigrants from Haiti (33.2%, a difference of 0.51%), Jamaican (33.2%, a difference of 0.60%), and Okinawan (32.8%, a difference of 0.63%).
| Demographics | Rating | Rank | In Labor Force | Age 16-19 |
| Immigrants | Belarus | 0.1 /100 | #291 | Tragic 33.4% |
| Haitians | 0.1 /100 | #292 | Tragic 33.4% |
| Immigrants | South America | 0.1 /100 | #293 | Tragic 33.3% |
| Argentineans | 0.1 /100 | #294 | Tragic 33.3% |
| Yup'ik | 0.1 /100 | #295 | Tragic 33.3% |
| Jamaicans | 0.1 /100 | #296 | Tragic 33.2% |
| Immigrants | Haiti | 0.1 /100 | #297 | Tragic 33.2% |
| Iranians | 0.0 /100 | #298 | Tragic 33.0% |
| Armenians | 0.0 /100 | #299 | Tragic 32.9% |
| Immigrants | Argentina | 0.0 /100 | #300 | Tragic 32.9% |
| Okinawans | 0.0 /100 | #301 | Tragic 32.8% |
| Belizeans | 0.0 /100 | #302 | Tragic 32.8% |
| Immigrants | Dominica | 0.0 /100 | #303 | Tragic 32.5% |
| Israelis | 0.0 /100 | #304 | Tragic 32.4% |
| Nicaraguans | 0.0 /100 | #305 | Tragic 32.4% |
Demographics Similar to Immigrants from Hungary by In Labor Force | Age 16-19
In terms of in labor force | age 16-19, the demographic groups most similar to Immigrants from Hungary are Panamanian (36.1%, a difference of 0.010%), Immigrants from Croatia (36.1%, a difference of 0.080%), Immigrants from Europe (36.2%, a difference of 0.18%), Afghan (36.1%, a difference of 0.20%), and Immigrants from Denmark (36.1%, a difference of 0.25%).
| Demographics | Rating | Rank | In Labor Force | Age 16-19 |
| Immigrants | Italy | 39.1 /100 | #182 | Fair 36.4% |
| Eastern Europeans | 38.8 /100 | #183 | Fair 36.4% |
| Costa Ricans | 36.1 /100 | #184 | Fair 36.3% |
| Bhutanese | 35.3 /100 | #185 | Fair 36.3% |
| Immigrants | Romania | 34.0 /100 | #186 | Fair 36.3% |
| Immigrants | Afghanistan | 34.0 /100 | #187 | Fair 36.3% |
| Immigrants | Europe | 31.8 /100 | #188 | Fair 36.2% |
| Immigrants | Hungary | 28.8 /100 | #189 | Fair 36.2% |
| Panamanians | 28.6 /100 | #190 | Fair 36.1% |
| Immigrants | Croatia | 27.5 /100 | #191 | Fair 36.1% |
| Afghans | 25.7 /100 | #192 | Fair 36.1% |
| Immigrants | Denmark | 25.0 /100 | #193 | Fair 36.1% |
| Nigerians | 24.6 /100 | #194 | Fair 36.1% |
| Bolivians | 23.3 /100 | #195 | Fair 36.0% |
| Mexican American Indians | 21.1 /100 | #196 | Fair 36.0% |