Lithuanian vs Nonimmigrants In Labor Force | Age > 16
COMPARE
Lithuanian
Nonimmigrants
In Labor Force | Age > 16
In Labor Force | Age > 16 Comparison
Lithuanians
Nonimmigrants
64.8%
IN LABOR FORCE | AGE > 16
17.4/ 100
METRIC RATING
206th/ 347
METRIC RANK
63.5%
IN LABOR FORCE | AGE > 16
0.0/ 100
METRIC RATING
304th/ 347
METRIC RANK
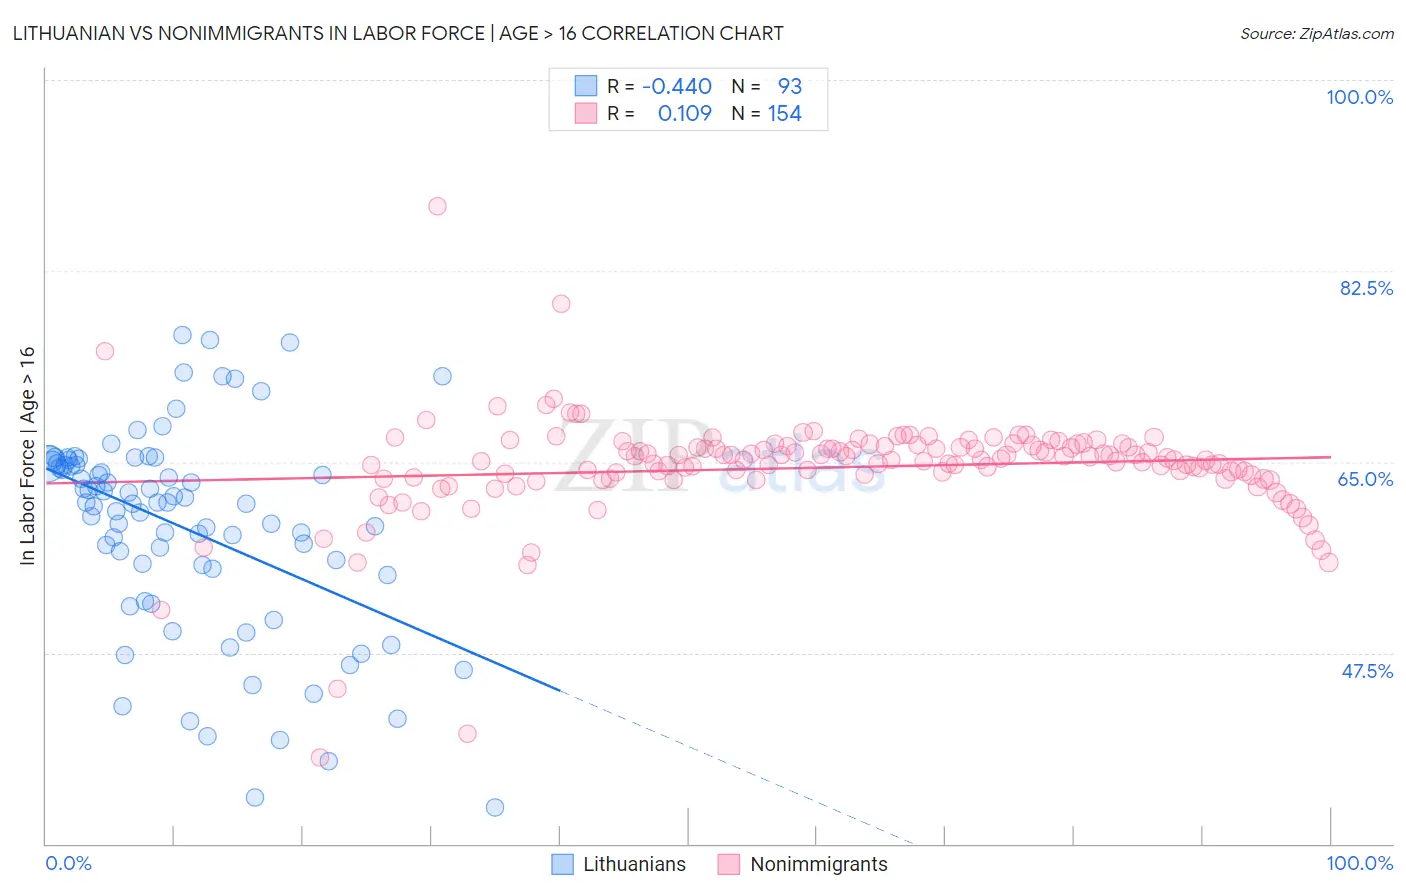
Lithuanian vs Nonimmigrants In Labor Force | Age > 16 Correlation Chart
The statistical analysis conducted on geographies consisting of 421,961,459 people shows a moderate negative correlation between the proportion of Lithuanians and labor force participation rate among population ages 16 and over in the United States with a correlation coefficient (R) of -0.440 and weighted average of 64.8%. Similarly, the statistical analysis conducted on geographies consisting of 585,341,591 people shows a poor positive correlation between the proportion of Nonimmigrants and labor force participation rate among population ages 16 and over in the United States with a correlation coefficient (R) of 0.109 and weighted average of 63.5%, a difference of 2.1%.
In Labor Force | Age > 16 Correlation Summary
| Measurement | Lithuanian | Nonimmigrants |
| Minimum | 33.3% | 37.9% |
| Maximum | 76.6% | 88.4% |
| Range | 43.3% | 50.5% |
| Mean | 59.0% | 64.5% |
| Median | 61.2% | 65.2% |
| Interquartile 25% (IQ1) | 54.9% | 63.5% |
| Interquartile 75% (IQ3) | 64.8% | 66.5% |
| Interquartile Range (IQR) | 9.9% | 3.0% |
| Standard Deviation (Sample) | 9.4% | 5.1% |
| Standard Deviation (Population) | 9.4% | 5.1% |
Similar Demographics by In Labor Force | Age > 16
Demographics Similar to Lithuanians by In Labor Force | Age > 16
In terms of in labor force | age > 16, the demographic groups most similar to Lithuanians are Immigrants from Latin America (64.8%, a difference of 0.020%), Belizean (64.8%, a difference of 0.020%), Russian (64.9%, a difference of 0.030%), Slovene (64.9%, a difference of 0.030%), and Jamaican (64.9%, a difference of 0.030%).
| Demographics | Rating | Rank | In Labor Force | Age > 16 |
| Mexican American Indians | 23.1 /100 | #199 | Fair 64.9% |
| Armenians | 20.2 /100 | #200 | Fair 64.9% |
| Ukrainians | 19.6 /100 | #201 | Poor 64.9% |
| Immigrants | Belgium | 19.4 /100 | #202 | Poor 64.9% |
| Russians | 18.8 /100 | #203 | Poor 64.9% |
| Slovenes | 18.7 /100 | #204 | Poor 64.9% |
| Jamaicans | 18.7 /100 | #205 | Poor 64.9% |
| Lithuanians | 17.4 /100 | #206 | Poor 64.8% |
| Immigrants | Latin America | 16.4 /100 | #207 | Poor 64.8% |
| Belizeans | 16.2 /100 | #208 | Poor 64.8% |
| Immigrants | Trinidad and Tobago | 15.6 /100 | #209 | Poor 64.8% |
| Immigrants | Denmark | 14.7 /100 | #210 | Poor 64.8% |
| Fijians | 14.1 /100 | #211 | Poor 64.8% |
| Alaskan Athabascans | 13.9 /100 | #212 | Poor 64.8% |
| Maltese | 13.8 /100 | #213 | Poor 64.8% |
Demographics Similar to Nonimmigrants by In Labor Force | Age > 16
In terms of in labor force | age > 16, the demographic groups most similar to Nonimmigrants are Cree (63.5%, a difference of 0.050%), Osage (63.5%, a difference of 0.050%), Delaware (63.6%, a difference of 0.090%), Spanish American (63.6%, a difference of 0.11%), and Immigrants from the Azores (63.6%, a difference of 0.13%).
| Demographics | Rating | Rank | In Labor Force | Age > 16 |
| Immigrants | Grenada | 0.0 /100 | #297 | Tragic 63.6% |
| Comanche | 0.0 /100 | #298 | Tragic 63.6% |
| Whites/Caucasians | 0.0 /100 | #299 | Tragic 63.6% |
| Immigrants | Azores | 0.0 /100 | #300 | Tragic 63.6% |
| Spanish Americans | 0.0 /100 | #301 | Tragic 63.6% |
| Delaware | 0.0 /100 | #302 | Tragic 63.6% |
| Cree | 0.0 /100 | #303 | Tragic 63.5% |
| Immigrants | Nonimmigrants | 0.0 /100 | #304 | Tragic 63.5% |
| Osage | 0.0 /100 | #305 | Tragic 63.5% |
| Blacks/African Americans | 0.0 /100 | #306 | Tragic 63.4% |
| Central American Indians | 0.0 /100 | #307 | Tragic 63.4% |
| Pennsylvania Germans | 0.0 /100 | #308 | Tragic 63.4% |
| Scotch-Irish | 0.0 /100 | #309 | Tragic 63.3% |
| Shoshone | 0.0 /100 | #310 | Tragic 63.2% |
| Blackfeet | 0.0 /100 | #311 | Tragic 63.2% |