Native Hawaiian vs Norwegian In Labor Force | Age > 16
COMPARE
Native Hawaiian
Norwegian
In Labor Force | Age > 16
In Labor Force | Age > 16 Comparison
Native Hawaiians
Norwegians
64.1%
IN LABOR FORCE | AGE > 16
0.3/ 100
METRIC RATING
272nd/ 347
METRIC RANK
65.7%
IN LABOR FORCE | AGE > 16
95.3/ 100
METRIC RATING
125th/ 347
METRIC RANK
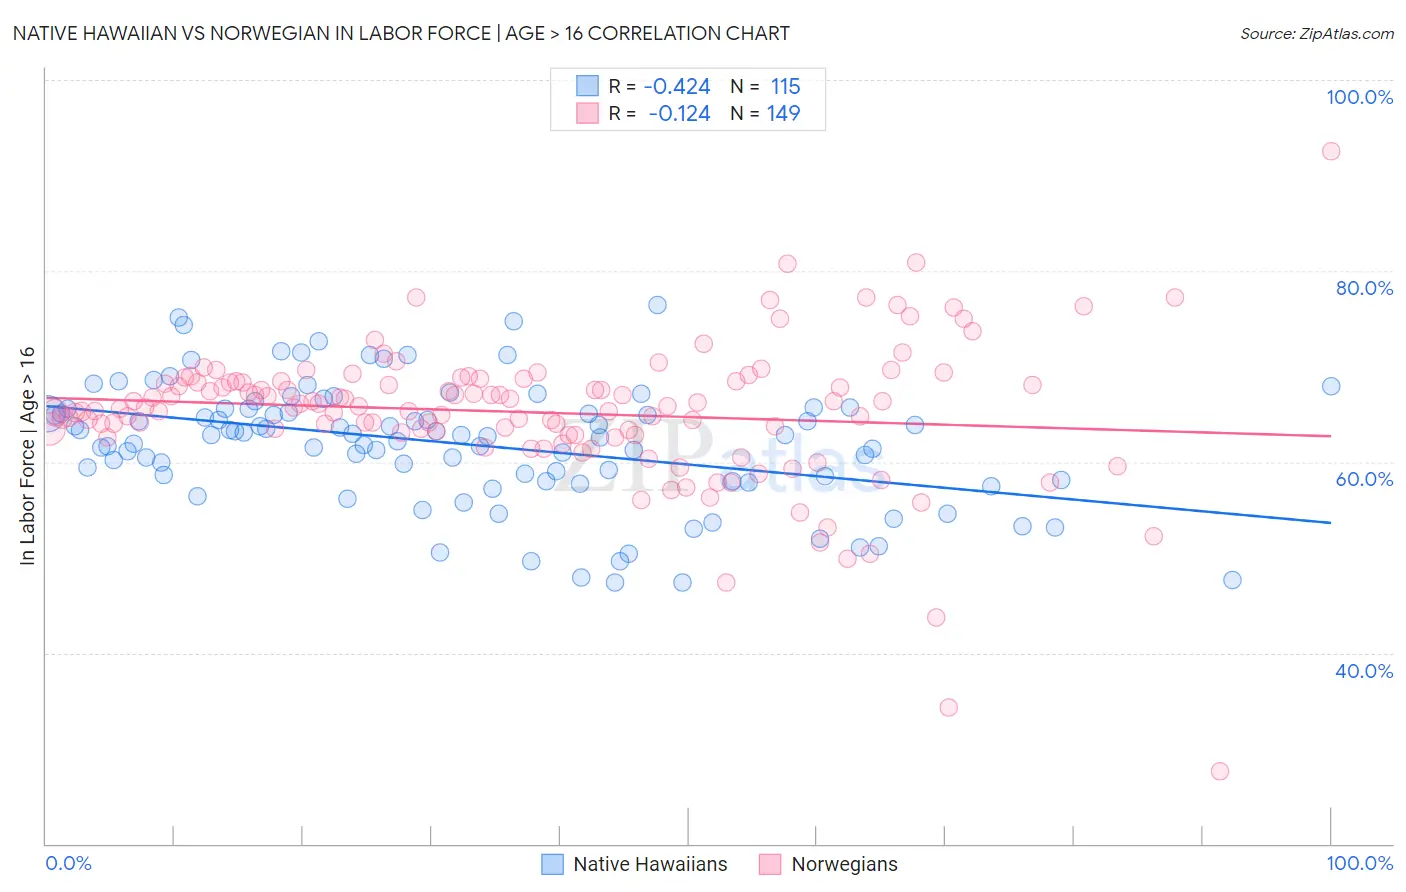
Native Hawaiian vs Norwegian In Labor Force | Age > 16 Correlation Chart
The statistical analysis conducted on geographies consisting of 332,118,603 people shows a moderate negative correlation between the proportion of Native Hawaiians and labor force participation rate among population ages 16 and over in the United States with a correlation coefficient (R) of -0.424 and weighted average of 64.1%. Similarly, the statistical analysis conducted on geographies consisting of 533,394,126 people shows a poor negative correlation between the proportion of Norwegians and labor force participation rate among population ages 16 and over in the United States with a correlation coefficient (R) of -0.124 and weighted average of 65.7%, a difference of 2.5%.
In Labor Force | Age > 16 Correlation Summary
| Measurement | Native Hawaiian | Norwegian |
| Minimum | 47.3% | 27.6% |
| Maximum | 76.4% | 92.5% |
| Range | 29.1% | 64.9% |
| Mean | 61.9% | 65.2% |
| Median | 62.8% | 65.8% |
| Interquartile 25% (IQ1) | 58.1% | 62.9% |
| Interquartile 75% (IQ3) | 65.6% | 68.5% |
| Interquartile Range (IQR) | 7.5% | 5.5% |
| Standard Deviation (Sample) | 6.3% | 7.5% |
| Standard Deviation (Population) | 6.3% | 7.5% |
Similar Demographics by In Labor Force | Age > 16
Demographics Similar to Native Hawaiians by In Labor Force | Age > 16
In terms of in labor force | age > 16, the demographic groups most similar to Native Hawaiians are Hmong (64.1%, a difference of 0.0%), Immigrants from Cuba (64.1%, a difference of 0.020%), Mexican (64.1%, a difference of 0.020%), French American Indian (64.1%, a difference of 0.020%), and Guyanese (64.1%, a difference of 0.030%).
| Demographics | Rating | Rank | In Labor Force | Age > 16 |
| Cubans | 0.5 /100 | #265 | Tragic 64.2% |
| Immigrants | England | 0.5 /100 | #266 | Tragic 64.2% |
| Canadians | 0.5 /100 | #267 | Tragic 64.1% |
| Spaniards | 0.5 /100 | #268 | Tragic 64.1% |
| Irish | 0.4 /100 | #269 | Tragic 64.1% |
| Guyanese | 0.4 /100 | #270 | Tragic 64.1% |
| Dominicans | 0.4 /100 | #271 | Tragic 64.1% |
| Native Hawaiians | 0.3 /100 | #272 | Tragic 64.1% |
| Hmong | 0.3 /100 | #273 | Tragic 64.1% |
| Immigrants | Cuba | 0.3 /100 | #274 | Tragic 64.1% |
| Mexicans | 0.3 /100 | #275 | Tragic 64.1% |
| French American Indians | 0.3 /100 | #276 | Tragic 64.1% |
| Immigrants | Bahamas | 0.3 /100 | #277 | Tragic 64.0% |
| Assyrians/Chaldeans/Syriacs | 0.3 /100 | #278 | Tragic 64.0% |
| Welsh | 0.2 /100 | #279 | Tragic 64.0% |
Demographics Similar to Norwegians by In Labor Force | Age > 16
In terms of in labor force | age > 16, the demographic groups most similar to Norwegians are Korean (65.7%, a difference of 0.0%), Immigrants from Iraq (65.7%, a difference of 0.010%), Iraqi (65.7%, a difference of 0.010%), Immigrants from Eastern Asia (65.7%, a difference of 0.030%), and Ecuadorian (65.6%, a difference of 0.030%).
| Demographics | Rating | Rank | In Labor Force | Age > 16 |
| Immigrants | Thailand | 96.6 /100 | #118 | Exceptional 65.7% |
| Immigrants | France | 96.4 /100 | #119 | Exceptional 65.7% |
| Immigrants | Hong Kong | 96.2 /100 | #120 | Exceptional 65.7% |
| New Zealanders | 96.0 /100 | #121 | Exceptional 65.7% |
| Immigrants | Ecuador | 95.9 /100 | #122 | Exceptional 65.7% |
| Immigrants | Iraq | 95.5 /100 | #123 | Exceptional 65.7% |
| Iraqis | 95.4 /100 | #124 | Exceptional 65.7% |
| Norwegians | 95.3 /100 | #125 | Exceptional 65.7% |
| Koreans | 95.3 /100 | #126 | Exceptional 65.7% |
| Immigrants | Eastern Asia | 94.9 /100 | #127 | Exceptional 65.7% |
| Ecuadorians | 94.7 /100 | #128 | Exceptional 65.6% |
| Immigrants | Philippines | 94.5 /100 | #129 | Exceptional 65.6% |
| Immigrants | Guatemala | 94.4 /100 | #130 | Exceptional 65.6% |
| Icelanders | 94.3 /100 | #131 | Exceptional 65.6% |
| Immigrants | North Macedonia | 94.1 /100 | #132 | Exceptional 65.6% |