Swedish vs Cree In Labor Force | Age 20-24
COMPARE
Swedish
Cree
In Labor Force | Age 20-24
In Labor Force | Age 20-24 Comparison
Swedes
Cree
78.8%
IN LABOR FORCE | AGE 20-24
100.0/ 100
METRIC RATING
9th/ 347
METRIC RANK
76.6%
IN LABOR FORCE | AGE 20-24
99.7/ 100
METRIC RATING
74th/ 347
METRIC RANK
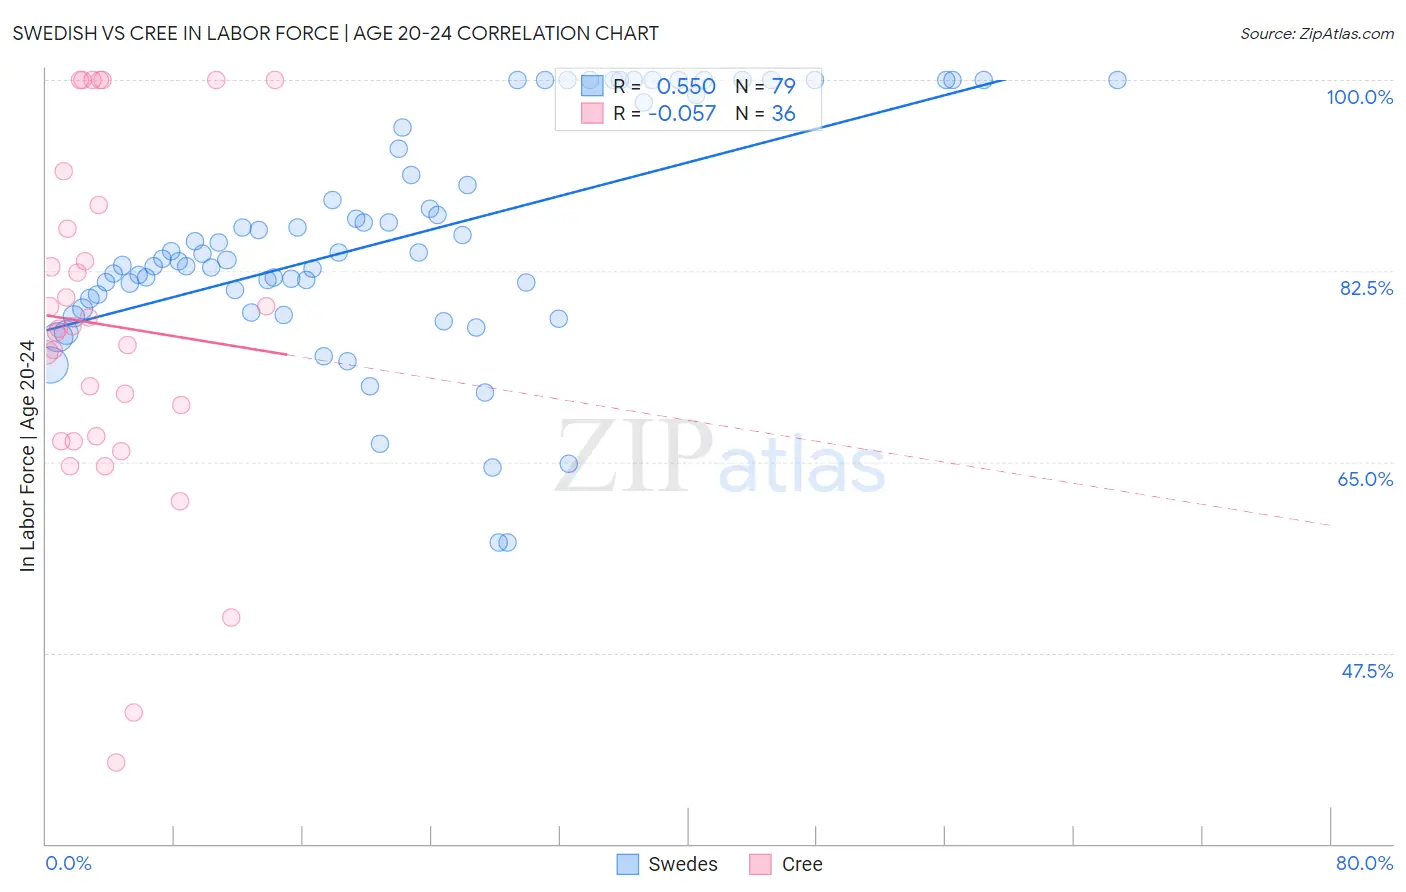
Swedish vs Cree In Labor Force | Age 20-24 Correlation Chart
The statistical analysis conducted on geographies consisting of 538,164,941 people shows a substantial positive correlation between the proportion of Swedes and labor force participation rate among population between the ages 20 and 24 in the United States with a correlation coefficient (R) of 0.550 and weighted average of 78.8%. Similarly, the statistical analysis conducted on geographies consisting of 76,182,817 people shows a slight negative correlation between the proportion of Cree and labor force participation rate among population between the ages 20 and 24 in the United States with a correlation coefficient (R) of -0.057 and weighted average of 76.6%, a difference of 2.8%.
In Labor Force | Age 20-24 Correlation Summary
| Measurement | Swedish | Cree |
| Minimum | 57.6% | 37.5% |
| Maximum | 100.0% | 100.0% |
| Range | 42.4% | 62.5% |
| Mean | 85.4% | 77.5% |
| Median | 83.6% | 77.3% |
| Interquartile 25% (IQ1) | 80.0% | 67.1% |
| Interquartile 75% (IQ3) | 95.6% | 87.4% |
| Interquartile Range (IQR) | 15.7% | 20.4% |
| Standard Deviation (Sample) | 10.4% | 15.9% |
| Standard Deviation (Population) | 10.4% | 15.6% |
Similar Demographics by In Labor Force | Age 20-24
Demographics Similar to Swedes by In Labor Force | Age 20-24
In terms of in labor force | age 20-24, the demographic groups most similar to Swedes are Immigrants from Cabo Verde (78.9%, a difference of 0.070%), Slovene (78.7%, a difference of 0.16%), Luxembourger (79.0%, a difference of 0.17%), Finnish (78.7%, a difference of 0.19%), and Danish (79.0%, a difference of 0.21%).
| Demographics | Rating | Rank | In Labor Force | Age 20-24 |
| Immigrants | Somalia | 100.0 /100 | #2 | Exceptional 79.5% |
| Somalis | 100.0 /100 | #3 | Exceptional 79.3% |
| Alaskan Athabascans | 100.0 /100 | #4 | Exceptional 79.1% |
| Aleuts | 100.0 /100 | #5 | Exceptional 79.0% |
| Danes | 100.0 /100 | #6 | Exceptional 79.0% |
| Luxembourgers | 100.0 /100 | #7 | Exceptional 79.0% |
| Immigrants | Cabo Verde | 100.0 /100 | #8 | Exceptional 78.9% |
| Swedes | 100.0 /100 | #9 | Exceptional 78.8% |
| Slovenes | 100.0 /100 | #10 | Exceptional 78.7% |
| Finns | 100.0 /100 | #11 | Exceptional 78.7% |
| Germans | 100.0 /100 | #12 | Exceptional 78.6% |
| Scandinavians | 100.0 /100 | #13 | Exceptional 78.5% |
| Czechs | 100.0 /100 | #14 | Exceptional 78.5% |
| Sudanese | 100.0 /100 | #15 | Exceptional 78.4% |
| Dutch | 100.0 /100 | #16 | Exceptional 78.4% |
Demographics Similar to Cree by In Labor Force | Age 20-24
In terms of in labor force | age 20-24, the demographic groups most similar to Cree are Immigrants from Middle Africa (76.6%, a difference of 0.020%), Immigrants from Moldova (76.6%, a difference of 0.060%), British (76.7%, a difference of 0.070%), Immigrants from Cameroon (76.6%, a difference of 0.090%), and Canadian (76.6%, a difference of 0.090%).
| Demographics | Rating | Rank | In Labor Force | Age 20-24 |
| Slavs | 99.9 /100 | #67 | Exceptional 76.9% |
| French American Indians | 99.8 /100 | #68 | Exceptional 76.8% |
| Immigrants | Sudan | 99.8 /100 | #69 | Exceptional 76.8% |
| Ottawa | 99.8 /100 | #70 | Exceptional 76.8% |
| Northern Europeans | 99.8 /100 | #71 | Exceptional 76.8% |
| Guamanians/Chamorros | 99.8 /100 | #72 | Exceptional 76.7% |
| British | 99.8 /100 | #73 | Exceptional 76.7% |
| Cree | 99.7 /100 | #74 | Exceptional 76.6% |
| Immigrants | Middle Africa | 99.7 /100 | #75 | Exceptional 76.6% |
| Immigrants | Moldova | 99.6 /100 | #76 | Exceptional 76.6% |
| Immigrants | Cameroon | 99.6 /100 | #77 | Exceptional 76.6% |
| Canadians | 99.6 /100 | #78 | Exceptional 76.6% |
| Immigrants | Zaire | 99.6 /100 | #79 | Exceptional 76.6% |
| Italians | 99.6 /100 | #80 | Exceptional 76.5% |
| Basques | 99.5 /100 | #81 | Exceptional 76.5% |