Liberian vs Tsimshian In Labor Force | Age 20-24
COMPARE
Liberian
Tsimshian
In Labor Force | Age 20-24
In Labor Force | Age 20-24 Comparison
Liberians
Tsimshian
78.0%
IN LABOR FORCE | AGE 20-24
100.0/ 100
METRIC RATING
24th/ 347
METRIC RANK
72.3%
IN LABOR FORCE | AGE 20-24
0.0/ 100
METRIC RATING
309th/ 347
METRIC RANK
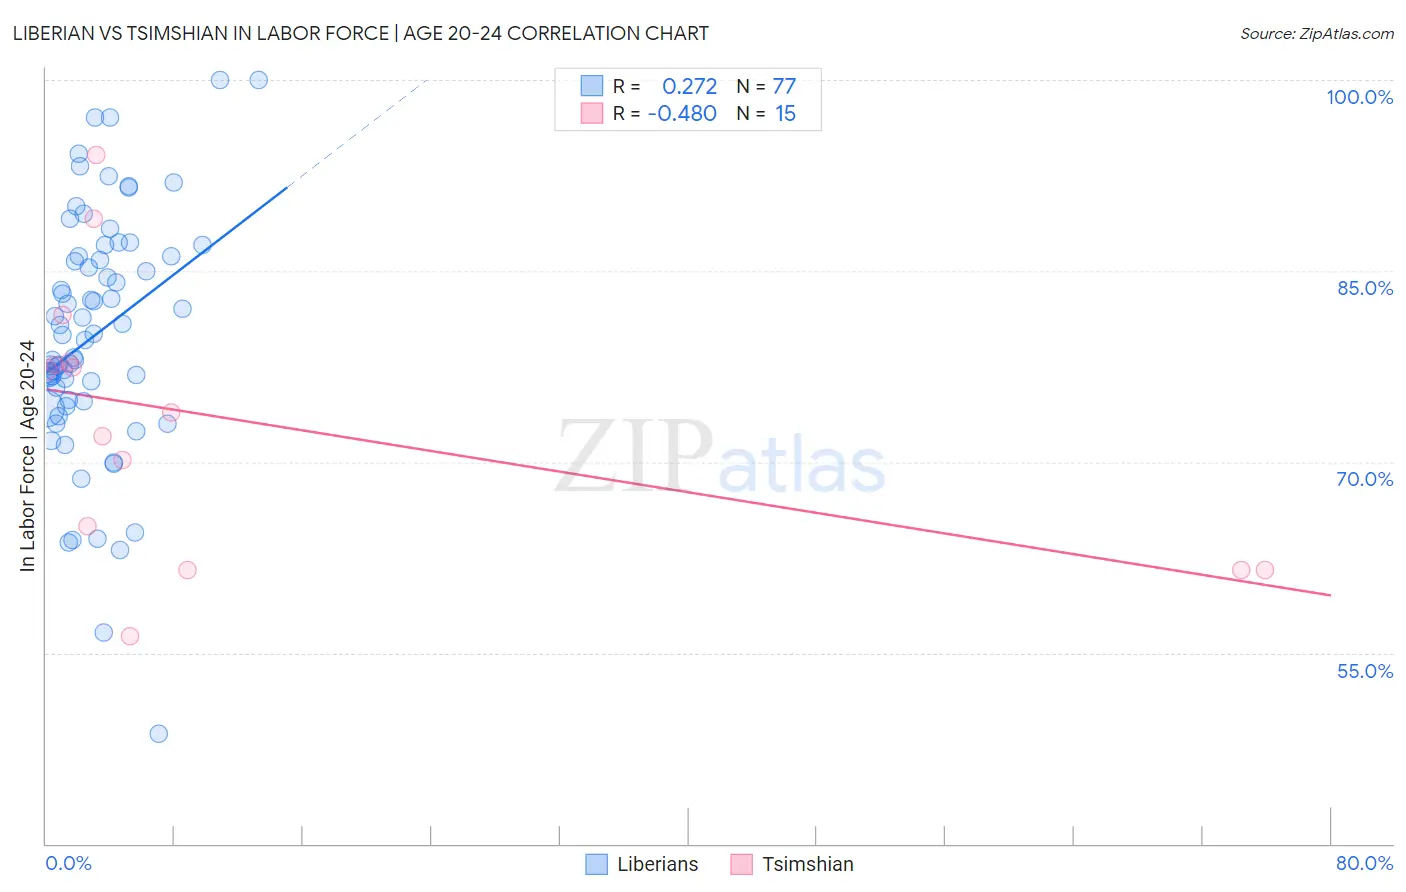
Liberian vs Tsimshian In Labor Force | Age 20-24 Correlation Chart
The statistical analysis conducted on geographies consisting of 118,080,661 people shows a weak positive correlation between the proportion of Liberians and labor force participation rate among population between the ages 20 and 24 in the United States with a correlation coefficient (R) of 0.272 and weighted average of 78.0%. Similarly, the statistical analysis conducted on geographies consisting of 15,626,462 people shows a moderate negative correlation between the proportion of Tsimshian and labor force participation rate among population between the ages 20 and 24 in the United States with a correlation coefficient (R) of -0.480 and weighted average of 72.3%, a difference of 7.9%.
In Labor Force | Age 20-24 Correlation Summary
| Measurement | Liberian | Tsimshian |
| Minimum | 48.6% | 56.3% |
| Maximum | 100.0% | 94.1% |
| Range | 51.4% | 37.8% |
| Mean | 80.0% | 73.1% |
| Median | 80.0% | 73.9% |
| Interquartile 25% (IQ1) | 74.8% | 61.5% |
| Interquartile 75% (IQ3) | 86.2% | 77.8% |
| Interquartile Range (IQR) | 11.4% | 16.3% |
| Standard Deviation (Sample) | 9.6% | 10.7% |
| Standard Deviation (Population) | 9.5% | 10.4% |
Similar Demographics by In Labor Force | Age 20-24
Demographics Similar to Liberians by In Labor Force | Age 20-24
In terms of in labor force | age 20-24, the demographic groups most similar to Liberians are Yugoslavian (78.0%, a difference of 0.0%), Pennsylvania German (78.0%, a difference of 0.010%), Tlingit-Haida (77.9%, a difference of 0.040%), Tongan (77.9%, a difference of 0.060%), and Puget Sound Salish (78.0%, a difference of 0.070%).
| Demographics | Rating | Rank | In Labor Force | Age 20-24 |
| Cape Verdeans | 100.0 /100 | #17 | Exceptional 78.3% |
| Immigrants | Bosnia and Herzegovina | 100.0 /100 | #18 | Exceptional 78.1% |
| Bangladeshis | 100.0 /100 | #19 | Exceptional 78.1% |
| French Canadians | 100.0 /100 | #20 | Exceptional 78.1% |
| Puget Sound Salish | 100.0 /100 | #21 | Exceptional 78.0% |
| Pennsylvania Germans | 100.0 /100 | #22 | Exceptional 78.0% |
| Yugoslavians | 100.0 /100 | #23 | Exceptional 78.0% |
| Liberians | 100.0 /100 | #24 | Exceptional 78.0% |
| Tlingit-Haida | 100.0 /100 | #25 | Exceptional 77.9% |
| Tongans | 100.0 /100 | #26 | Exceptional 77.9% |
| Immigrants | Micronesia | 100.0 /100 | #27 | Exceptional 77.8% |
| Belgians | 100.0 /100 | #28 | Exceptional 77.8% |
| Slovaks | 100.0 /100 | #29 | Exceptional 77.7% |
| Swiss | 100.0 /100 | #30 | Exceptional 77.7% |
| Poles | 100.0 /100 | #31 | Exceptional 77.6% |
Demographics Similar to Tsimshian by In Labor Force | Age 20-24
In terms of in labor force | age 20-24, the demographic groups most similar to Tsimshian are Soviet Union (72.3%, a difference of 0.0%), Immigrants from Ecuador (72.3%, a difference of 0.010%), Immigrants from Jamaica (72.4%, a difference of 0.16%), Immigrants from Singapore (72.4%, a difference of 0.19%), and Immigrants from West Indies (72.4%, a difference of 0.21%).
| Demographics | Rating | Rank | In Labor Force | Age 20-24 |
| Natives/Alaskans | 0.0 /100 | #302 | Tragic 72.4% |
| Ecuadorians | 0.0 /100 | #303 | Tragic 72.4% |
| Immigrants | West Indies | 0.0 /100 | #304 | Tragic 72.4% |
| Immigrants | Singapore | 0.0 /100 | #305 | Tragic 72.4% |
| Immigrants | Jamaica | 0.0 /100 | #306 | Tragic 72.4% |
| Immigrants | Ecuador | 0.0 /100 | #307 | Tragic 72.3% |
| Soviet Union | 0.0 /100 | #308 | Tragic 72.3% |
| Tsimshian | 0.0 /100 | #309 | Tragic 72.3% |
| Immigrants | Cuba | 0.0 /100 | #310 | Tragic 72.0% |
| Apache | 0.0 /100 | #311 | Tragic 72.0% |
| Immigrants | Caribbean | 0.0 /100 | #312 | Tragic 71.9% |
| Immigrants | Dominica | 0.0 /100 | #313 | Tragic 71.9% |
| Indians (Asian) | 0.0 /100 | #314 | Tragic 71.9% |
| Immigrants | Iran | 0.0 /100 | #315 | Tragic 71.8% |
| Immigrants | Eastern Asia | 0.0 /100 | #316 | Tragic 71.8% |