Liberian vs Immigrants from Bangladesh In Labor Force | Age 20-24
COMPARE
Liberian
Immigrants from Bangladesh
In Labor Force | Age 20-24
In Labor Force | Age 20-24 Comparison
Liberians
Immigrants from Bangladesh
78.0%
IN LABOR FORCE | AGE 20-24
100.0/ 100
METRIC RATING
24th/ 347
METRIC RANK
70.6%
IN LABOR FORCE | AGE 20-24
0.0/ 100
METRIC RATING
331st/ 347
METRIC RANK
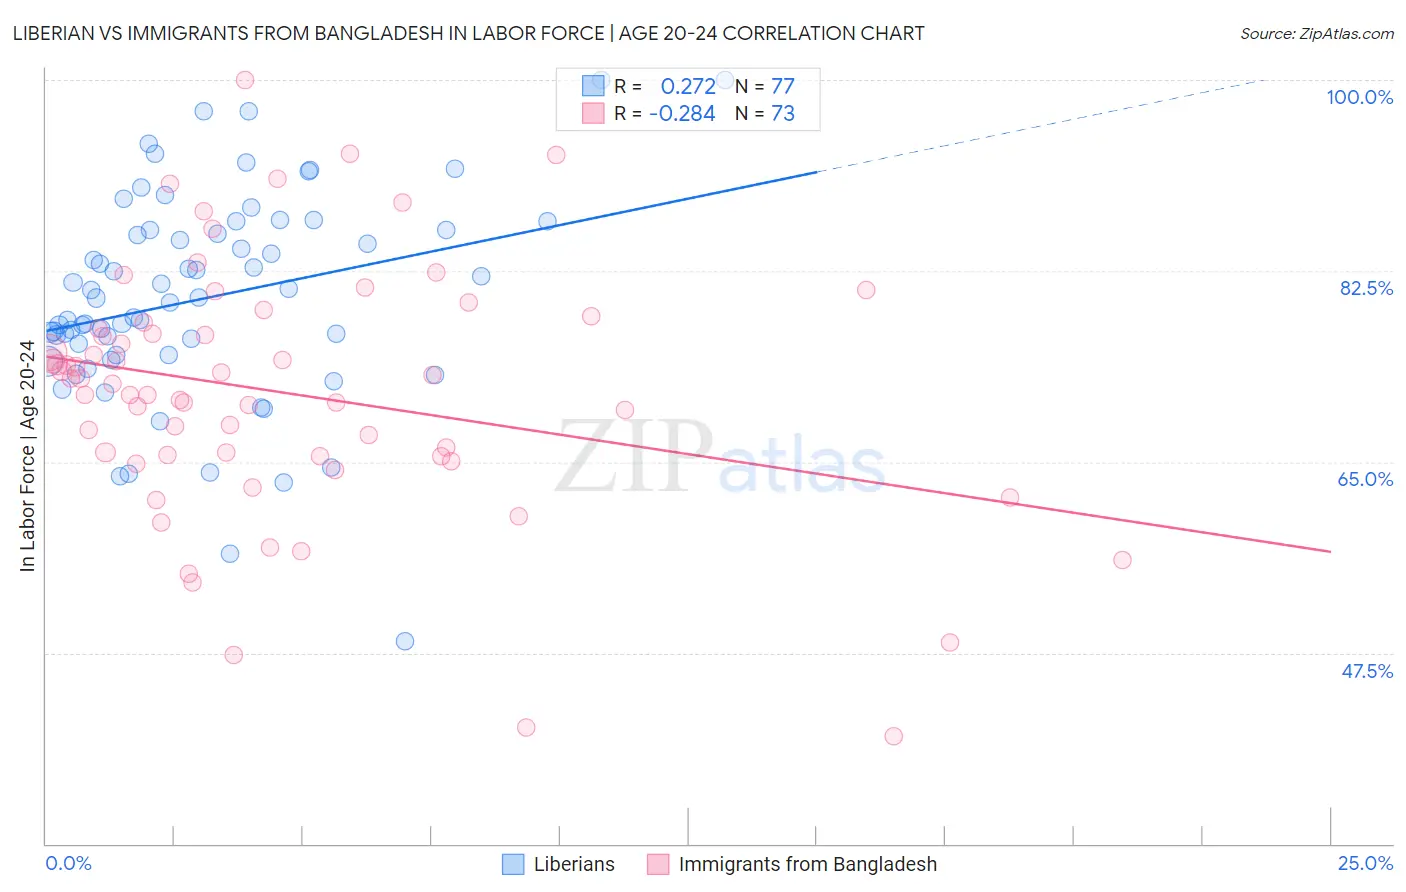
Liberian vs Immigrants from Bangladesh In Labor Force | Age 20-24 Correlation Chart
The statistical analysis conducted on geographies consisting of 118,080,661 people shows a weak positive correlation between the proportion of Liberians and labor force participation rate among population between the ages 20 and 24 in the United States with a correlation coefficient (R) of 0.272 and weighted average of 78.0%. Similarly, the statistical analysis conducted on geographies consisting of 203,671,040 people shows a weak negative correlation between the proportion of Immigrants from Bangladesh and labor force participation rate among population between the ages 20 and 24 in the United States with a correlation coefficient (R) of -0.284 and weighted average of 70.6%, a difference of 10.4%.
In Labor Force | Age 20-24 Correlation Summary
| Measurement | Liberian | Immigrants from Bangladesh |
| Minimum | 48.6% | 39.8% |
| Maximum | 100.0% | 100.0% |
| Range | 51.4% | 60.2% |
| Mean | 80.0% | 71.3% |
| Median | 80.0% | 72.1% |
| Interquartile 25% (IQ1) | 74.8% | 65.5% |
| Interquartile 75% (IQ3) | 86.2% | 77.5% |
| Interquartile Range (IQR) | 11.4% | 12.0% |
| Standard Deviation (Sample) | 9.6% | 11.5% |
| Standard Deviation (Population) | 9.5% | 11.5% |
Similar Demographics by In Labor Force | Age 20-24
Demographics Similar to Liberians by In Labor Force | Age 20-24
In terms of in labor force | age 20-24, the demographic groups most similar to Liberians are Yugoslavian (78.0%, a difference of 0.0%), Pennsylvania German (78.0%, a difference of 0.010%), Tlingit-Haida (77.9%, a difference of 0.040%), Tongan (77.9%, a difference of 0.060%), and Puget Sound Salish (78.0%, a difference of 0.070%).
| Demographics | Rating | Rank | In Labor Force | Age 20-24 |
| Cape Verdeans | 100.0 /100 | #17 | Exceptional 78.3% |
| Immigrants | Bosnia and Herzegovina | 100.0 /100 | #18 | Exceptional 78.1% |
| Bangladeshis | 100.0 /100 | #19 | Exceptional 78.1% |
| French Canadians | 100.0 /100 | #20 | Exceptional 78.1% |
| Puget Sound Salish | 100.0 /100 | #21 | Exceptional 78.0% |
| Pennsylvania Germans | 100.0 /100 | #22 | Exceptional 78.0% |
| Yugoslavians | 100.0 /100 | #23 | Exceptional 78.0% |
| Liberians | 100.0 /100 | #24 | Exceptional 78.0% |
| Tlingit-Haida | 100.0 /100 | #25 | Exceptional 77.9% |
| Tongans | 100.0 /100 | #26 | Exceptional 77.9% |
| Immigrants | Micronesia | 100.0 /100 | #27 | Exceptional 77.8% |
| Belgians | 100.0 /100 | #28 | Exceptional 77.8% |
| Slovaks | 100.0 /100 | #29 | Exceptional 77.7% |
| Swiss | 100.0 /100 | #30 | Exceptional 77.7% |
| Poles | 100.0 /100 | #31 | Exceptional 77.6% |
Demographics Similar to Immigrants from Bangladesh by In Labor Force | Age 20-24
In terms of in labor force | age 20-24, the demographic groups most similar to Immigrants from Bangladesh are Vietnamese (70.6%, a difference of 0.020%), Immigrants from Uzbekistan (70.4%, a difference of 0.30%), Yup'ik (70.9%, a difference of 0.37%), Yuman (70.3%, a difference of 0.53%), and Immigrants from China (71.1%, a difference of 0.61%).
| Demographics | Rating | Rank | In Labor Force | Age 20-24 |
| Immigrants | Dominican Republic | 0.0 /100 | #324 | Tragic 71.2% |
| Barbadians | 0.0 /100 | #325 | Tragic 71.1% |
| Dominicans | 0.0 /100 | #326 | Tragic 71.1% |
| Immigrants | Trinidad and Tobago | 0.0 /100 | #327 | Tragic 71.1% |
| Immigrants | China | 0.0 /100 | #328 | Tragic 71.1% |
| Yup'ik | 0.0 /100 | #329 | Tragic 70.9% |
| Vietnamese | 0.0 /100 | #330 | Tragic 70.6% |
| Immigrants | Bangladesh | 0.0 /100 | #331 | Tragic 70.6% |
| Immigrants | Uzbekistan | 0.0 /100 | #332 | Tragic 70.4% |
| Yuman | 0.0 /100 | #333 | Tragic 70.3% |
| British West Indians | 0.0 /100 | #334 | Tragic 70.0% |
| Immigrants | Barbados | 0.0 /100 | #335 | Tragic 69.7% |
| Immigrants | Guyana | 0.0 /100 | #336 | Tragic 69.3% |
| Guyanese | 0.0 /100 | #337 | Tragic 69.2% |
| Pima | 0.0 /100 | #338 | Tragic 69.0% |