Immigrants from Pakistan vs Tsimshian In Labor Force | Age 20-24
COMPARE
Immigrants from Pakistan
Tsimshian
In Labor Force | Age 20-24
In Labor Force | Age 20-24 Comparison
Immigrants from Pakistan
Tsimshian
73.8%
IN LABOR FORCE | AGE 20-24
0.9/ 100
METRIC RATING
255th/ 347
METRIC RANK
72.3%
IN LABOR FORCE | AGE 20-24
0.0/ 100
METRIC RATING
309th/ 347
METRIC RANK
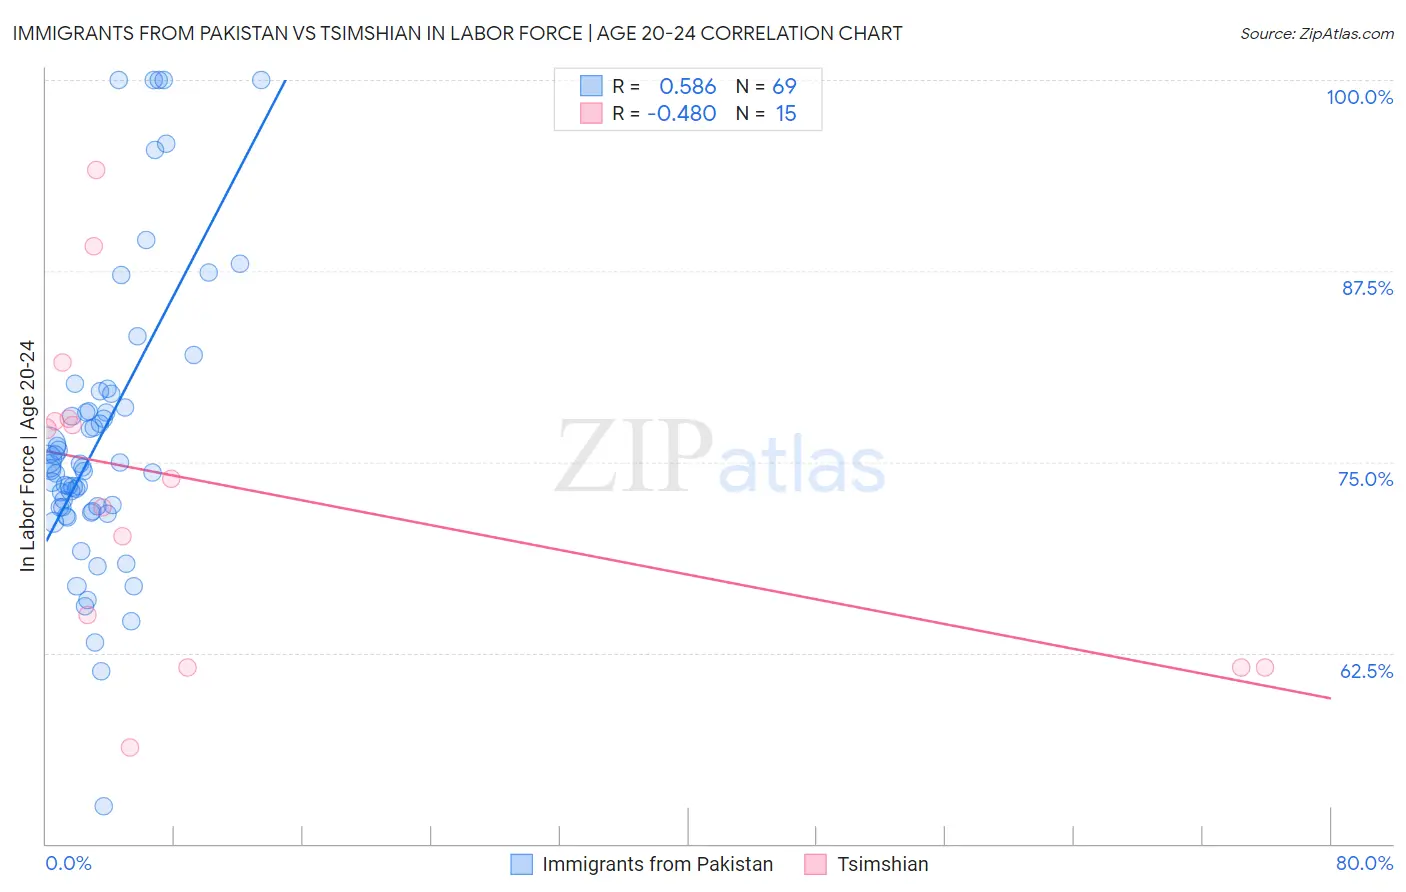
Immigrants from Pakistan vs Tsimshian In Labor Force | Age 20-24 Correlation Chart
The statistical analysis conducted on geographies consisting of 283,855,002 people shows a substantial positive correlation between the proportion of Immigrants from Pakistan and labor force participation rate among population between the ages 20 and 24 in the United States with a correlation coefficient (R) of 0.586 and weighted average of 73.8%. Similarly, the statistical analysis conducted on geographies consisting of 15,626,462 people shows a moderate negative correlation between the proportion of Tsimshian and labor force participation rate among population between the ages 20 and 24 in the United States with a correlation coefficient (R) of -0.480 and weighted average of 72.3%, a difference of 2.1%.
In Labor Force | Age 20-24 Correlation Summary
| Measurement | Immigrants from Pakistan | Tsimshian |
| Minimum | 52.5% | 56.3% |
| Maximum | 100.0% | 94.1% |
| Range | 47.5% | 37.8% |
| Mean | 76.7% | 73.1% |
| Median | 74.6% | 73.9% |
| Interquartile 25% (IQ1) | 71.9% | 61.5% |
| Interquartile 75% (IQ3) | 79.0% | 77.8% |
| Interquartile Range (IQR) | 7.2% | 16.3% |
| Standard Deviation (Sample) | 9.6% | 10.7% |
| Standard Deviation (Population) | 9.5% | 10.4% |
Similar Demographics by In Labor Force | Age 20-24
Demographics Similar to Immigrants from Pakistan by In Labor Force | Age 20-24
In terms of in labor force | age 20-24, the demographic groups most similar to Immigrants from Pakistan are Ute (73.8%, a difference of 0.020%), Arapaho (73.8%, a difference of 0.030%), Spanish American Indian (73.7%, a difference of 0.040%), Paraguayan (73.7%, a difference of 0.060%), and Immigrants from Kazakhstan (73.8%, a difference of 0.070%).
| Demographics | Rating | Rank | In Labor Force | Age 20-24 |
| Immigrants | Saudi Arabia | 1.5 /100 | #248 | Tragic 73.9% |
| Blacks/African Americans | 1.3 /100 | #249 | Tragic 73.9% |
| Immigrants | Belgium | 1.3 /100 | #250 | Tragic 73.9% |
| Immigrants | Egypt | 1.2 /100 | #251 | Tragic 73.8% |
| Immigrants | Kazakhstan | 1.1 /100 | #252 | Tragic 73.8% |
| Arapaho | 1.0 /100 | #253 | Tragic 73.8% |
| Ute | 1.0 /100 | #254 | Tragic 73.8% |
| Immigrants | Pakistan | 0.9 /100 | #255 | Tragic 73.8% |
| Spanish American Indians | 0.8 /100 | #256 | Tragic 73.7% |
| Paraguayans | 0.8 /100 | #257 | Tragic 73.7% |
| Egyptians | 0.7 /100 | #258 | Tragic 73.7% |
| Dutch West Indians | 0.7 /100 | #259 | Tragic 73.7% |
| Immigrants | Turkey | 0.7 /100 | #260 | Tragic 73.7% |
| Houma | 0.6 /100 | #261 | Tragic 73.7% |
| Asians | 0.6 /100 | #262 | Tragic 73.7% |
Demographics Similar to Tsimshian by In Labor Force | Age 20-24
In terms of in labor force | age 20-24, the demographic groups most similar to Tsimshian are Soviet Union (72.3%, a difference of 0.0%), Immigrants from Ecuador (72.3%, a difference of 0.010%), Immigrants from Jamaica (72.4%, a difference of 0.16%), Immigrants from Singapore (72.4%, a difference of 0.19%), and Immigrants from West Indies (72.4%, a difference of 0.21%).
| Demographics | Rating | Rank | In Labor Force | Age 20-24 |
| Natives/Alaskans | 0.0 /100 | #302 | Tragic 72.4% |
| Ecuadorians | 0.0 /100 | #303 | Tragic 72.4% |
| Immigrants | West Indies | 0.0 /100 | #304 | Tragic 72.4% |
| Immigrants | Singapore | 0.0 /100 | #305 | Tragic 72.4% |
| Immigrants | Jamaica | 0.0 /100 | #306 | Tragic 72.4% |
| Immigrants | Ecuador | 0.0 /100 | #307 | Tragic 72.3% |
| Soviet Union | 0.0 /100 | #308 | Tragic 72.3% |
| Tsimshian | 0.0 /100 | #309 | Tragic 72.3% |
| Immigrants | Cuba | 0.0 /100 | #310 | Tragic 72.0% |
| Apache | 0.0 /100 | #311 | Tragic 72.0% |
| Immigrants | Caribbean | 0.0 /100 | #312 | Tragic 71.9% |
| Immigrants | Dominica | 0.0 /100 | #313 | Tragic 71.9% |
| Indians (Asian) | 0.0 /100 | #314 | Tragic 71.9% |
| Immigrants | Iran | 0.0 /100 | #315 | Tragic 71.8% |
| Immigrants | Eastern Asia | 0.0 /100 | #316 | Tragic 71.8% |