Liberian vs Tsimshian Bachelor's Degree
COMPARE
Liberian
Tsimshian
Bachelor's Degree
Bachelor's Degree Comparison
Liberians
Tsimshian
34.6%
BACHELOR'S DEGREE
2.8/ 100
METRIC RATING
236th/ 347
METRIC RANK
28.8%
BACHELOR'S DEGREE
0.0/ 100
METRIC RATING
322nd/ 347
METRIC RANK
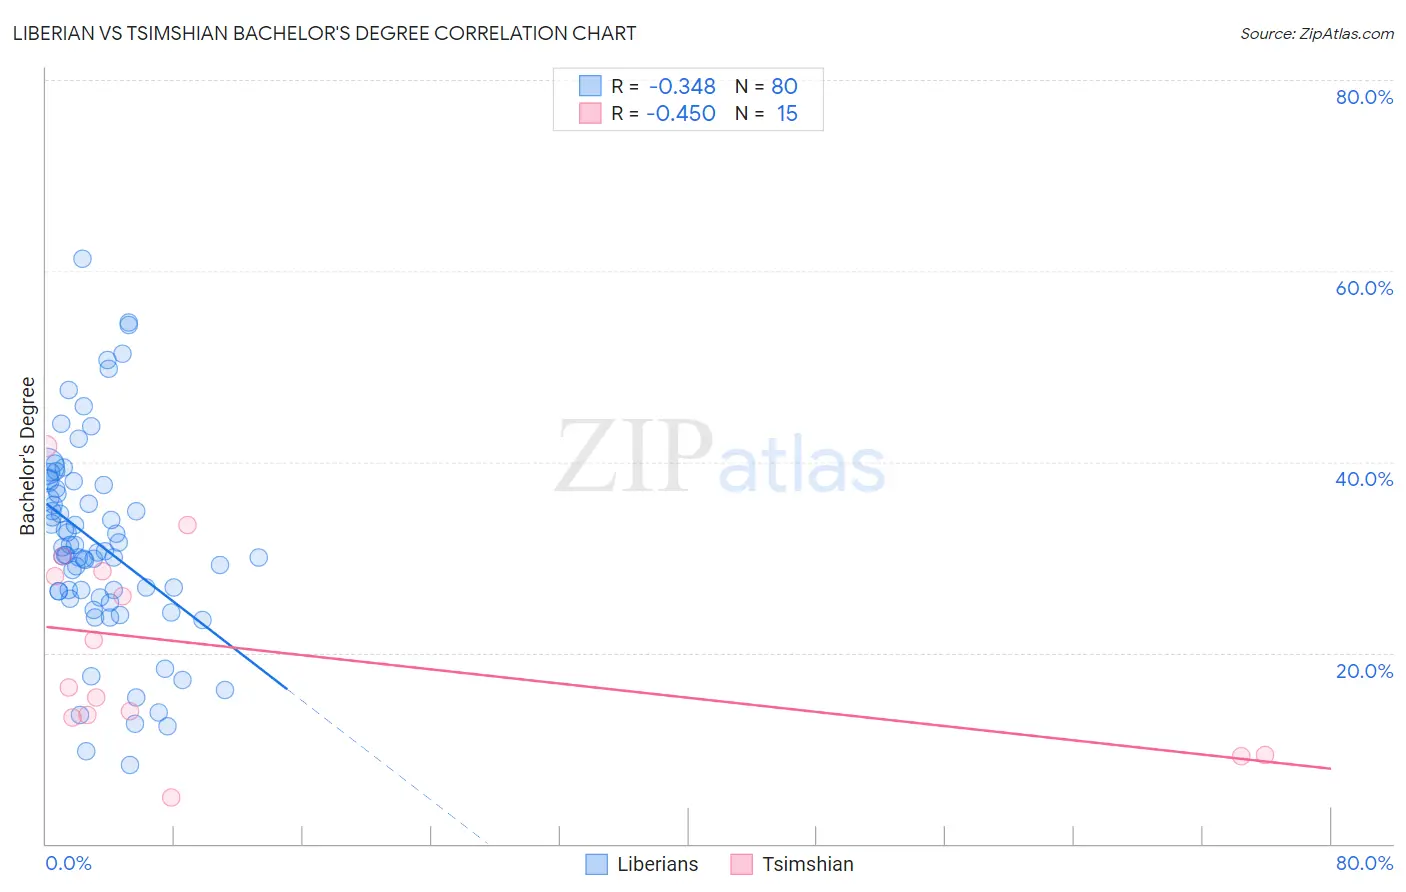
Liberian vs Tsimshian Bachelor's Degree Correlation Chart
The statistical analysis conducted on geographies consisting of 118,099,075 people shows a mild negative correlation between the proportion of Liberians and percentage of population with at least bachelor's degree education in the United States with a correlation coefficient (R) of -0.348 and weighted average of 34.6%. Similarly, the statistical analysis conducted on geographies consisting of 15,626,544 people shows a moderate negative correlation between the proportion of Tsimshian and percentage of population with at least bachelor's degree education in the United States with a correlation coefficient (R) of -0.450 and weighted average of 28.8%, a difference of 20.2%.
Bachelor's Degree Correlation Summary
| Measurement | Liberian | Tsimshian |
| Minimum | 8.2% | 4.9% |
| Maximum | 61.3% | 41.6% |
| Range | 53.0% | 36.7% |
| Mean | 31.5% | 20.3% |
| Median | 30.6% | 16.4% |
| Interquartile 25% (IQ1) | 26.1% | 13.3% |
| Interquartile 75% (IQ3) | 37.3% | 28.5% |
| Interquartile Range (IQR) | 11.2% | 15.3% |
| Standard Deviation (Sample) | 10.5% | 10.5% |
| Standard Deviation (Population) | 10.4% | 10.1% |
Similar Demographics by Bachelor's Degree
Demographics Similar to Liberians by Bachelor's Degree
In terms of bachelor's degree, the demographic groups most similar to Liberians are Tlingit-Haida (34.6%, a difference of 0.040%), Immigrants from West Indies (34.6%, a difference of 0.11%), Guamanian/Chamorro (34.6%, a difference of 0.20%), Guyanese (34.5%, a difference of 0.32%), and British West Indian (34.5%, a difference of 0.34%).
| Demographics | Rating | Rank | Bachelor's Degree |
| Whites/Caucasians | 5.9 /100 | #229 | Tragic 35.3% |
| Immigrants | Grenada | 4.3 /100 | #230 | Tragic 35.0% |
| Immigrants | St. Vincent and the Grenadines | 4.3 /100 | #231 | Tragic 35.0% |
| Hmong | 3.4 /100 | #232 | Tragic 34.8% |
| Immigrants | Ecuador | 3.3 /100 | #233 | Tragic 34.7% |
| Guamanians/Chamorros | 3.0 /100 | #234 | Tragic 34.6% |
| Immigrants | West Indies | 2.9 /100 | #235 | Tragic 34.6% |
| Liberians | 2.8 /100 | #236 | Tragic 34.6% |
| Tlingit-Haida | 2.8 /100 | #237 | Tragic 34.6% |
| Guyanese | 2.5 /100 | #238 | Tragic 34.5% |
| British West Indians | 2.5 /100 | #239 | Tragic 34.5% |
| Tongans | 2.0 /100 | #240 | Tragic 34.3% |
| Immigrants | Cambodia | 1.9 /100 | #241 | Tragic 34.2% |
| Immigrants | Nonimmigrants | 1.8 /100 | #242 | Tragic 34.2% |
| Immigrants | Guyana | 1.4 /100 | #243 | Tragic 33.9% |
Demographics Similar to Tsimshian by Bachelor's Degree
In terms of bachelor's degree, the demographic groups most similar to Tsimshian are Fijian (28.7%, a difference of 0.14%), Alaskan Athabascan (28.8%, a difference of 0.22%), Kiowa (28.8%, a difference of 0.30%), Creek (28.9%, a difference of 0.35%), and Yaqui (29.0%, a difference of 0.80%).
| Demographics | Rating | Rank | Bachelor's Degree |
| Immigrants | Cabo Verde | 0.0 /100 | #315 | Tragic 29.2% |
| Sioux | 0.0 /100 | #316 | Tragic 29.1% |
| Colville | 0.0 /100 | #317 | Tragic 29.0% |
| Yaqui | 0.0 /100 | #318 | Tragic 29.0% |
| Creek | 0.0 /100 | #319 | Tragic 28.9% |
| Kiowa | 0.0 /100 | #320 | Tragic 28.8% |
| Alaskan Athabascans | 0.0 /100 | #321 | Tragic 28.8% |
| Tsimshian | 0.0 /100 | #322 | Tragic 28.8% |
| Fijians | 0.0 /100 | #323 | Tragic 28.7% |
| Dutch West Indians | 0.0 /100 | #324 | Tragic 28.5% |
| Pennsylvania Germans | 0.0 /100 | #325 | Tragic 28.4% |
| Apache | 0.0 /100 | #326 | Tragic 28.3% |
| Paiute | 0.0 /100 | #327 | Tragic 28.1% |
| Crow | 0.0 /100 | #328 | Tragic 27.7% |
| Immigrants | Central America | 0.0 /100 | #329 | Tragic 27.5% |