Liberian vs Immigrants from Belarus Bachelor's Degree
COMPARE
Liberian
Immigrants from Belarus
Bachelor's Degree
Bachelor's Degree Comparison
Liberians
Immigrants from Belarus
34.6%
BACHELOR'S DEGREE
2.8/ 100
METRIC RATING
236th/ 347
METRIC RANK
45.0%
BACHELOR'S DEGREE
100.0/ 100
METRIC RATING
40th/ 347
METRIC RANK
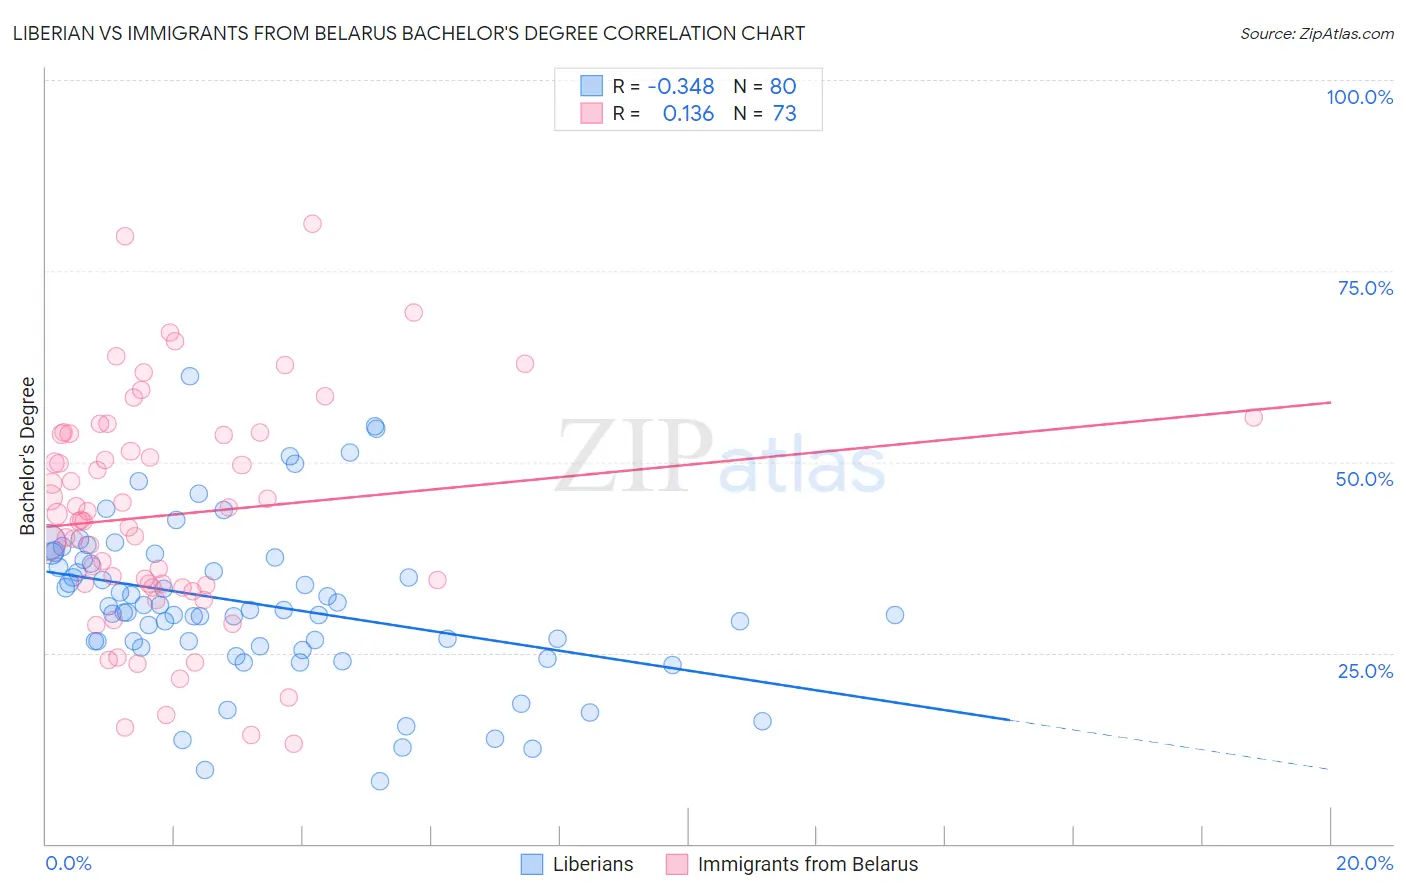
Liberian vs Immigrants from Belarus Bachelor's Degree Correlation Chart
The statistical analysis conducted on geographies consisting of 118,099,075 people shows a mild negative correlation between the proportion of Liberians and percentage of population with at least bachelor's degree education in the United States with a correlation coefficient (R) of -0.348 and weighted average of 34.6%. Similarly, the statistical analysis conducted on geographies consisting of 150,192,988 people shows a poor positive correlation between the proportion of Immigrants from Belarus and percentage of population with at least bachelor's degree education in the United States with a correlation coefficient (R) of 0.136 and weighted average of 45.0%, a difference of 30.2%.
Bachelor's Degree Correlation Summary
| Measurement | Liberian | Immigrants from Belarus |
| Minimum | 8.2% | 13.1% |
| Maximum | 61.3% | 81.2% |
| Range | 53.0% | 68.1% |
| Mean | 31.5% | 43.1% |
| Median | 30.6% | 42.3% |
| Interquartile 25% (IQ1) | 26.1% | 33.8% |
| Interquartile 75% (IQ3) | 37.3% | 53.7% |
| Interquartile Range (IQR) | 11.2% | 19.9% |
| Standard Deviation (Sample) | 10.5% | 14.8% |
| Standard Deviation (Population) | 10.4% | 14.7% |
Similar Demographics by Bachelor's Degree
Demographics Similar to Liberians by Bachelor's Degree
In terms of bachelor's degree, the demographic groups most similar to Liberians are Tlingit-Haida (34.6%, a difference of 0.040%), Immigrants from West Indies (34.6%, a difference of 0.11%), Guamanian/Chamorro (34.6%, a difference of 0.20%), Guyanese (34.5%, a difference of 0.32%), and British West Indian (34.5%, a difference of 0.34%).
| Demographics | Rating | Rank | Bachelor's Degree |
| Whites/Caucasians | 5.9 /100 | #229 | Tragic 35.3% |
| Immigrants | Grenada | 4.3 /100 | #230 | Tragic 35.0% |
| Immigrants | St. Vincent and the Grenadines | 4.3 /100 | #231 | Tragic 35.0% |
| Hmong | 3.4 /100 | #232 | Tragic 34.8% |
| Immigrants | Ecuador | 3.3 /100 | #233 | Tragic 34.7% |
| Guamanians/Chamorros | 3.0 /100 | #234 | Tragic 34.6% |
| Immigrants | West Indies | 2.9 /100 | #235 | Tragic 34.6% |
| Liberians | 2.8 /100 | #236 | Tragic 34.6% |
| Tlingit-Haida | 2.8 /100 | #237 | Tragic 34.6% |
| Guyanese | 2.5 /100 | #238 | Tragic 34.5% |
| British West Indians | 2.5 /100 | #239 | Tragic 34.5% |
| Tongans | 2.0 /100 | #240 | Tragic 34.3% |
| Immigrants | Cambodia | 1.9 /100 | #241 | Tragic 34.2% |
| Immigrants | Nonimmigrants | 1.8 /100 | #242 | Tragic 34.2% |
| Immigrants | Guyana | 1.4 /100 | #243 | Tragic 33.9% |
Demographics Similar to Immigrants from Belarus by Bachelor's Degree
In terms of bachelor's degree, the demographic groups most similar to Immigrants from Belarus are Immigrants from Malaysia (45.0%, a difference of 0.040%), Immigrants from Latvia (45.1%, a difference of 0.27%), Immigrants from Saudi Arabia (44.8%, a difference of 0.42%), Immigrants from South Africa (44.8%, a difference of 0.56%), and Bulgarian (45.3%, a difference of 0.60%).
| Demographics | Rating | Rank | Bachelor's Degree |
| Immigrants | Northern Europe | 100.0 /100 | #33 | Exceptional 45.6% |
| Immigrants | Denmark | 100.0 /100 | #34 | Exceptional 45.4% |
| Immigrants | Russia | 100.0 /100 | #35 | Exceptional 45.4% |
| Mongolians | 100.0 /100 | #36 | Exceptional 45.4% |
| Russians | 100.0 /100 | #37 | Exceptional 45.3% |
| Bulgarians | 100.0 /100 | #38 | Exceptional 45.3% |
| Immigrants | Latvia | 100.0 /100 | #39 | Exceptional 45.1% |
| Immigrants | Belarus | 100.0 /100 | #40 | Exceptional 45.0% |
| Immigrants | Malaysia | 100.0 /100 | #41 | Exceptional 45.0% |
| Immigrants | Saudi Arabia | 100.0 /100 | #42 | Exceptional 44.8% |
| Immigrants | South Africa | 99.9 /100 | #43 | Exceptional 44.8% |
| Immigrants | Lithuania | 99.9 /100 | #44 | Exceptional 44.6% |
| Immigrants | Kuwait | 99.9 /100 | #45 | Exceptional 44.6% |
| Immigrants | Bulgaria | 99.9 /100 | #46 | Exceptional 44.6% |
| Bolivians | 99.9 /100 | #47 | Exceptional 44.6% |