Bhutanese vs Cambodian In Labor Force | Age 16-19
COMPARE
Bhutanese
Cambodian
In Labor Force | Age 16-19
In Labor Force | Age 16-19 Comparison
Bhutanese
Cambodians
36.3%
IN LABOR FORCE | AGE 16-19
35.3/ 100
METRIC RATING
185th/ 347
METRIC RANK
37.0%
IN LABOR FORCE | AGE 16-19
71.5/ 100
METRIC RATING
161st/ 347
METRIC RANK
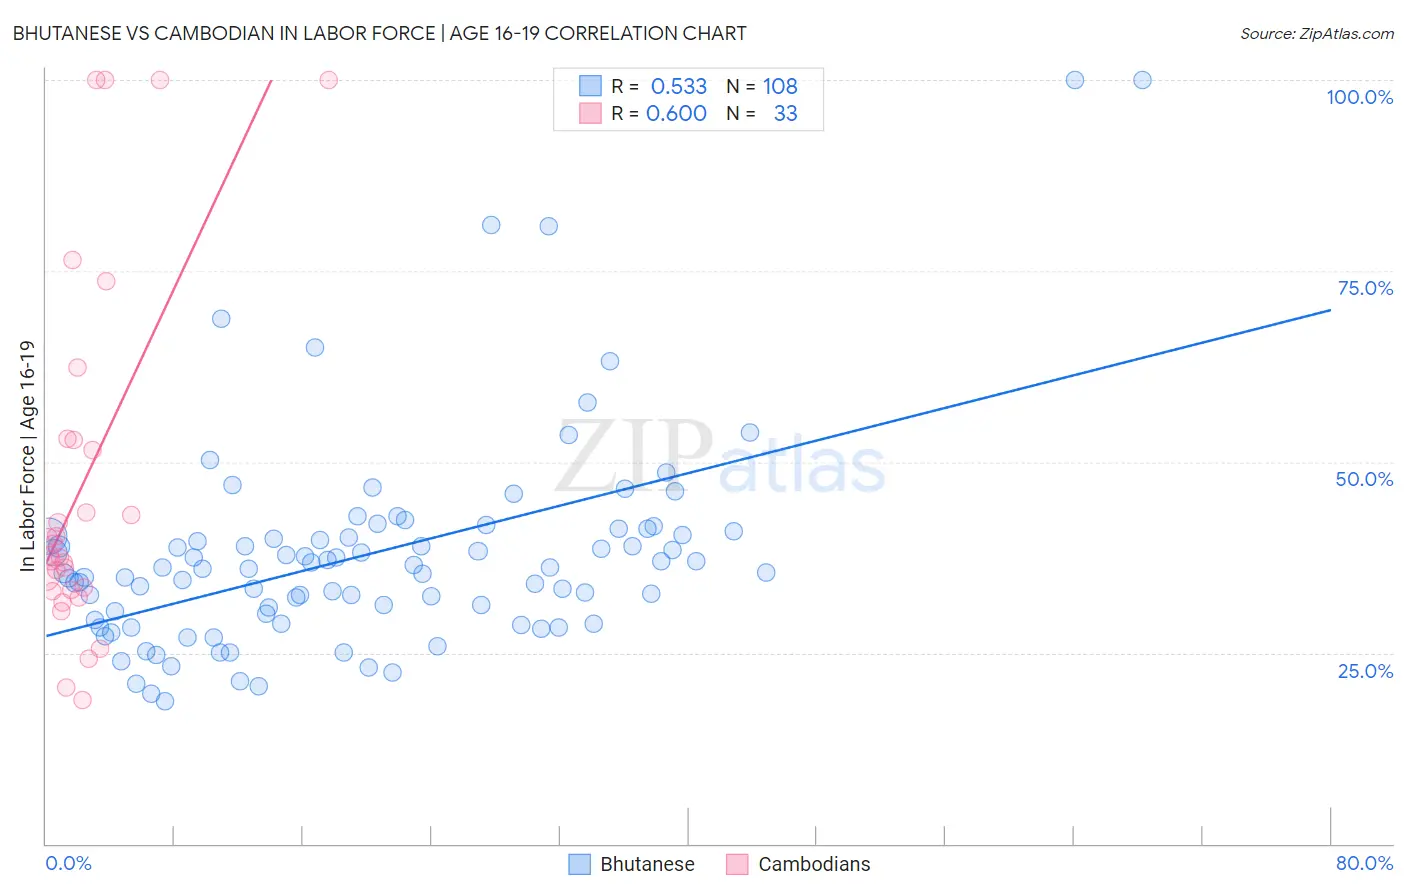
Bhutanese vs Cambodian In Labor Force | Age 16-19 Correlation Chart
The statistical analysis conducted on geographies consisting of 454,665,515 people shows a substantial positive correlation between the proportion of Bhutanese and labor force participation rate among population between the ages 16 and 19 in the United States with a correlation coefficient (R) of 0.533 and weighted average of 36.3%. Similarly, the statistical analysis conducted on geographies consisting of 102,494,767 people shows a significant positive correlation between the proportion of Cambodians and labor force participation rate among population between the ages 16 and 19 in the United States with a correlation coefficient (R) of 0.600 and weighted average of 37.0%, a difference of 1.9%.
In Labor Force | Age 16-19 Correlation Summary
| Measurement | Bhutanese | Cambodian |
| Minimum | 18.6% | 18.8% |
| Maximum | 100.0% | 100.0% |
| Range | 81.4% | 81.2% |
| Mean | 37.8% | 47.2% |
| Median | 36.0% | 37.7% |
| Interquartile 25% (IQ1) | 29.8% | 33.2% |
| Interquartile 75% (IQ3) | 40.4% | 53.0% |
| Interquartile Range (IQR) | 10.6% | 19.8% |
| Standard Deviation (Sample) | 13.9% | 23.6% |
| Standard Deviation (Population) | 13.8% | 23.3% |
Similar Demographics by In Labor Force | Age 16-19
Demographics Similar to Bhutanese by In Labor Force | Age 16-19
In terms of in labor force | age 16-19, the demographic groups most similar to Bhutanese are Costa Rican (36.3%, a difference of 0.040%), Immigrants from Romania (36.3%, a difference of 0.070%), Immigrants from Afghanistan (36.3%, a difference of 0.080%), Eastern European (36.4%, a difference of 0.19%), and Immigrants from Europe (36.2%, a difference of 0.20%).
| Demographics | Rating | Rank | In Labor Force | Age 16-19 |
| Blacks/African Americans | 45.1 /100 | #178 | Average 36.5% |
| Immigrants | Southern Europe | 43.3 /100 | #179 | Average 36.4% |
| Immigrants | Morocco | 41.1 /100 | #180 | Average 36.4% |
| Jordanians | 39.6 /100 | #181 | Fair 36.4% |
| Immigrants | Italy | 39.1 /100 | #182 | Fair 36.4% |
| Eastern Europeans | 38.8 /100 | #183 | Fair 36.4% |
| Costa Ricans | 36.1 /100 | #184 | Fair 36.3% |
| Bhutanese | 35.3 /100 | #185 | Fair 36.3% |
| Immigrants | Romania | 34.0 /100 | #186 | Fair 36.3% |
| Immigrants | Afghanistan | 34.0 /100 | #187 | Fair 36.3% |
| Immigrants | Europe | 31.8 /100 | #188 | Fair 36.2% |
| Immigrants | Hungary | 28.8 /100 | #189 | Fair 36.2% |
| Panamanians | 28.6 /100 | #190 | Fair 36.1% |
| Immigrants | Croatia | 27.5 /100 | #191 | Fair 36.1% |
| Afghans | 25.7 /100 | #192 | Fair 36.1% |
Demographics Similar to Cambodians by In Labor Force | Age 16-19
In terms of in labor force | age 16-19, the demographic groups most similar to Cambodians are Immigrants from Jordan (36.9%, a difference of 0.12%), Bermudan (36.9%, a difference of 0.13%), Immigrants from Saudi Arabia (37.0%, a difference of 0.15%), Immigrants from Kuwait (36.9%, a difference of 0.16%), and Yaqui (37.1%, a difference of 0.18%).
| Demographics | Rating | Rank | In Labor Force | Age 16-19 |
| Immigrants | Bulgaria | 81.6 /100 | #154 | Excellent 37.3% |
| Immigrants | Lithuania | 80.7 /100 | #155 | Excellent 37.2% |
| Kiowa | 80.4 /100 | #156 | Excellent 37.2% |
| Immigrants | Brazil | 76.5 /100 | #157 | Good 37.1% |
| Ute | 75.7 /100 | #158 | Good 37.1% |
| Yaqui | 74.4 /100 | #159 | Good 37.1% |
| Immigrants | Saudi Arabia | 73.9 /100 | #160 | Good 37.0% |
| Cambodians | 71.5 /100 | #161 | Good 37.0% |
| Immigrants | Jordan | 69.5 /100 | #162 | Good 36.9% |
| Bermudans | 69.3 /100 | #163 | Good 36.9% |
| Immigrants | Kuwait | 68.9 /100 | #164 | Good 36.9% |
| Yakama | 66.9 /100 | #165 | Good 36.9% |
| Immigrants | Western Africa | 66.7 /100 | #166 | Good 36.9% |
| Arabs | 63.6 /100 | #167 | Good 36.8% |
| Palestinians | 63.1 /100 | #168 | Good 36.8% |