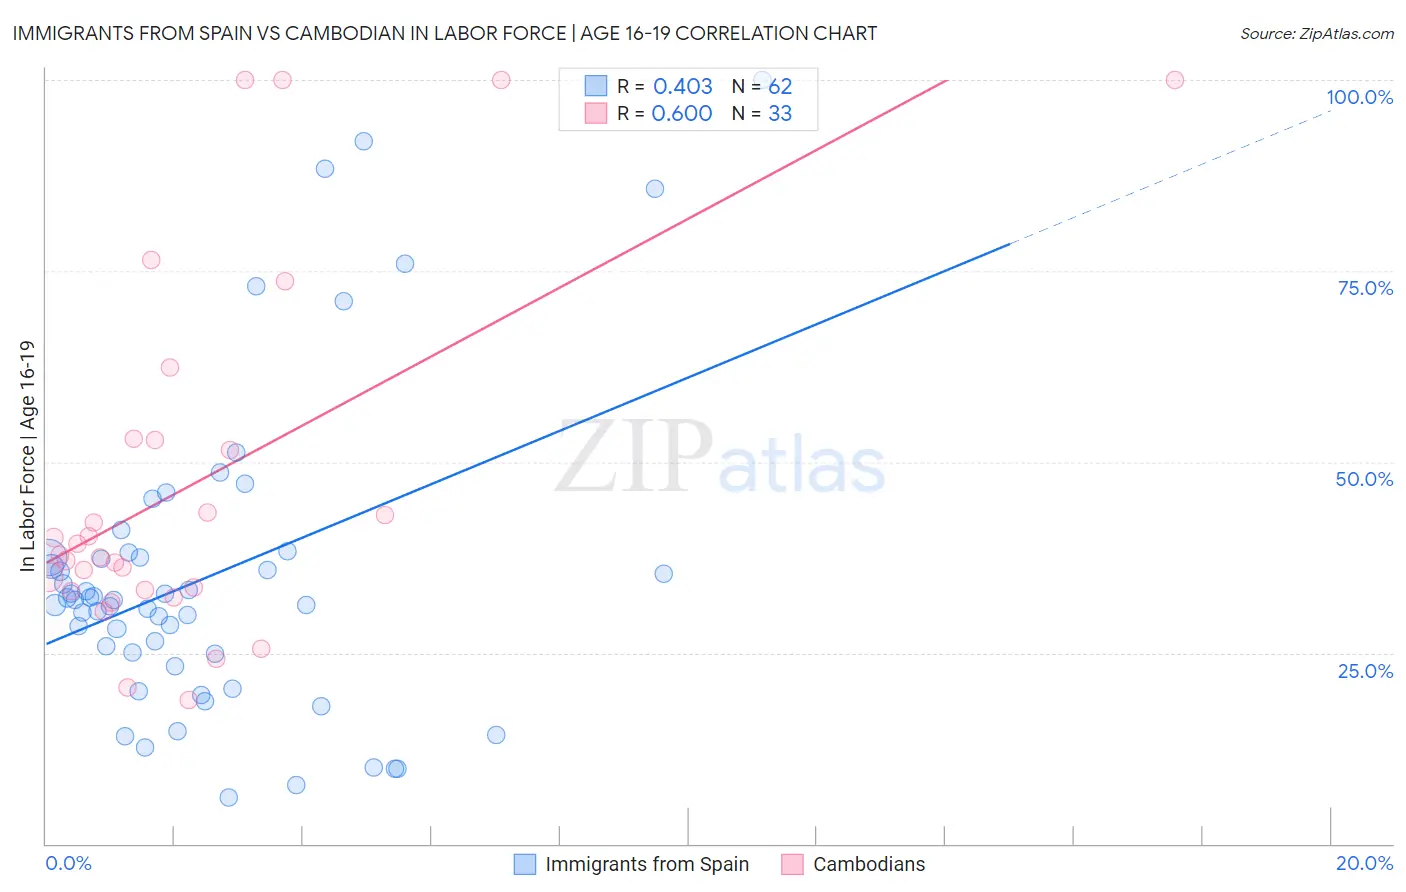
Immigrants from Spain vs Cambodian In Labor Force | Age 16-19
COMPARE
Immigrants from Spain
Cambodian
In Labor Force | Age 16-19
In Labor Force | Age 16-19 Comparison
Immigrants from Spain
Cambodians
33.7%
IN LABOR FORCE | AGE 16-19
0.2/ 100
METRIC RATING
284th/ 347
METRIC RANK
37.0%
IN LABOR FORCE | AGE 16-19
71.5/ 100
METRIC RATING
161st/ 347
METRIC RANK
Immigrants from Spain vs Cambodian In Labor Force | Age 16-19 Correlation Chart
The statistical analysis conducted on geographies consisting of 239,401,400 people shows a moderate positive correlation between the proportion of Immigrants from Spain and labor force participation rate among population between the ages 16 and 19 in the United States with a correlation coefficient (R) of 0.403 and weighted average of 33.7%. Similarly, the statistical analysis conducted on geographies consisting of 102,494,767 people shows a significant positive correlation between the proportion of Cambodians and labor force participation rate among population between the ages 16 and 19 in the United States with a correlation coefficient (R) of 0.600 and weighted average of 37.0%, a difference of 9.8%.
In Labor Force | Age 16-19 Correlation Summary
| Measurement | Immigrants from Spain | Cambodian |
| Minimum | 6.1% | 18.8% |
| Maximum | 100.0% | 100.0% |
| Range | 93.9% | 81.2% |
| Mean | 35.1% | 47.2% |
| Median | 31.9% | 37.7% |
| Interquartile 25% (IQ1) | 24.8% | 33.2% |
| Interquartile 75% (IQ3) | 37.5% | 53.0% |
| Interquartile Range (IQR) | 12.7% | 19.8% |
| Standard Deviation (Sample) | 20.5% | 23.6% |
| Standard Deviation (Population) | 20.3% | 23.3% |
Similar Demographics by In Labor Force | Age 16-19
Demographics Similar to Immigrants from Spain by In Labor Force | Age 16-19
In terms of in labor force | age 16-19, the demographic groups most similar to Immigrants from Spain are Immigrants from Venezuela (33.7%, a difference of 0.060%), U.S. Virgin Islander (33.6%, a difference of 0.19%), South American (33.6%, a difference of 0.27%), Immigrants from Korea (33.8%, a difference of 0.41%), and Cypriot (33.8%, a difference of 0.42%).
| Demographics | Rating | Rank | In Labor Force | Age 16-19 |
| Menominee | 0.3 /100 | #277 | Tragic 33.9% |
| Colombians | 0.3 /100 | #278 | Tragic 33.8% |
| Paraguayans | 0.3 /100 | #279 | Tragic 33.8% |
| Taiwanese | 0.3 /100 | #280 | Tragic 33.8% |
| Cypriots | 0.3 /100 | #281 | Tragic 33.8% |
| Immigrants | Korea | 0.3 /100 | #282 | Tragic 33.8% |
| Immigrants | Venezuela | 0.2 /100 | #283 | Tragic 33.7% |
| Immigrants | Spain | 0.2 /100 | #284 | Tragic 33.7% |
| U.S. Virgin Islanders | 0.2 /100 | #285 | Tragic 33.6% |
| South Americans | 0.2 /100 | #286 | Tragic 33.6% |
| Nepalese | 0.1 /100 | #287 | Tragic 33.5% |
| Immigrants | Indonesia | 0.1 /100 | #288 | Tragic 33.5% |
| Immigrants | Singapore | 0.1 /100 | #289 | Tragic 33.5% |
| Immigrants | Colombia | 0.1 /100 | #290 | Tragic 33.5% |
| Immigrants | Belarus | 0.1 /100 | #291 | Tragic 33.4% |
Demographics Similar to Cambodians by In Labor Force | Age 16-19
In terms of in labor force | age 16-19, the demographic groups most similar to Cambodians are Immigrants from Jordan (36.9%, a difference of 0.12%), Bermudan (36.9%, a difference of 0.13%), Immigrants from Saudi Arabia (37.0%, a difference of 0.15%), Immigrants from Kuwait (36.9%, a difference of 0.16%), and Yaqui (37.1%, a difference of 0.18%).
| Demographics | Rating | Rank | In Labor Force | Age 16-19 |
| Immigrants | Bulgaria | 81.6 /100 | #154 | Excellent 37.3% |
| Immigrants | Lithuania | 80.7 /100 | #155 | Excellent 37.2% |
| Kiowa | 80.4 /100 | #156 | Excellent 37.2% |
| Immigrants | Brazil | 76.5 /100 | #157 | Good 37.1% |
| Ute | 75.7 /100 | #158 | Good 37.1% |
| Yaqui | 74.4 /100 | #159 | Good 37.1% |
| Immigrants | Saudi Arabia | 73.9 /100 | #160 | Good 37.0% |
| Cambodians | 71.5 /100 | #161 | Good 37.0% |
| Immigrants | Jordan | 69.5 /100 | #162 | Good 36.9% |
| Bermudans | 69.3 /100 | #163 | Good 36.9% |
| Immigrants | Kuwait | 68.9 /100 | #164 | Good 36.9% |
| Yakama | 66.9 /100 | #165 | Good 36.9% |
| Immigrants | Western Africa | 66.7 /100 | #166 | Good 36.9% |
| Arabs | 63.6 /100 | #167 | Good 36.8% |
| Palestinians | 63.1 /100 | #168 | Good 36.8% |