Lebanese vs French In Labor Force | Age 25-29
COMPARE
Lebanese
French
In Labor Force | Age 25-29
In Labor Force | Age 25-29 Comparison
Lebanese
French
84.3%
IN LABOR FORCE | AGE 25-29
11.1/ 100
METRIC RATING
214th/ 347
METRIC RANK
84.7%
IN LABOR FORCE | AGE 25-29
61.0/ 100
METRIC RATING
156th/ 347
METRIC RANK
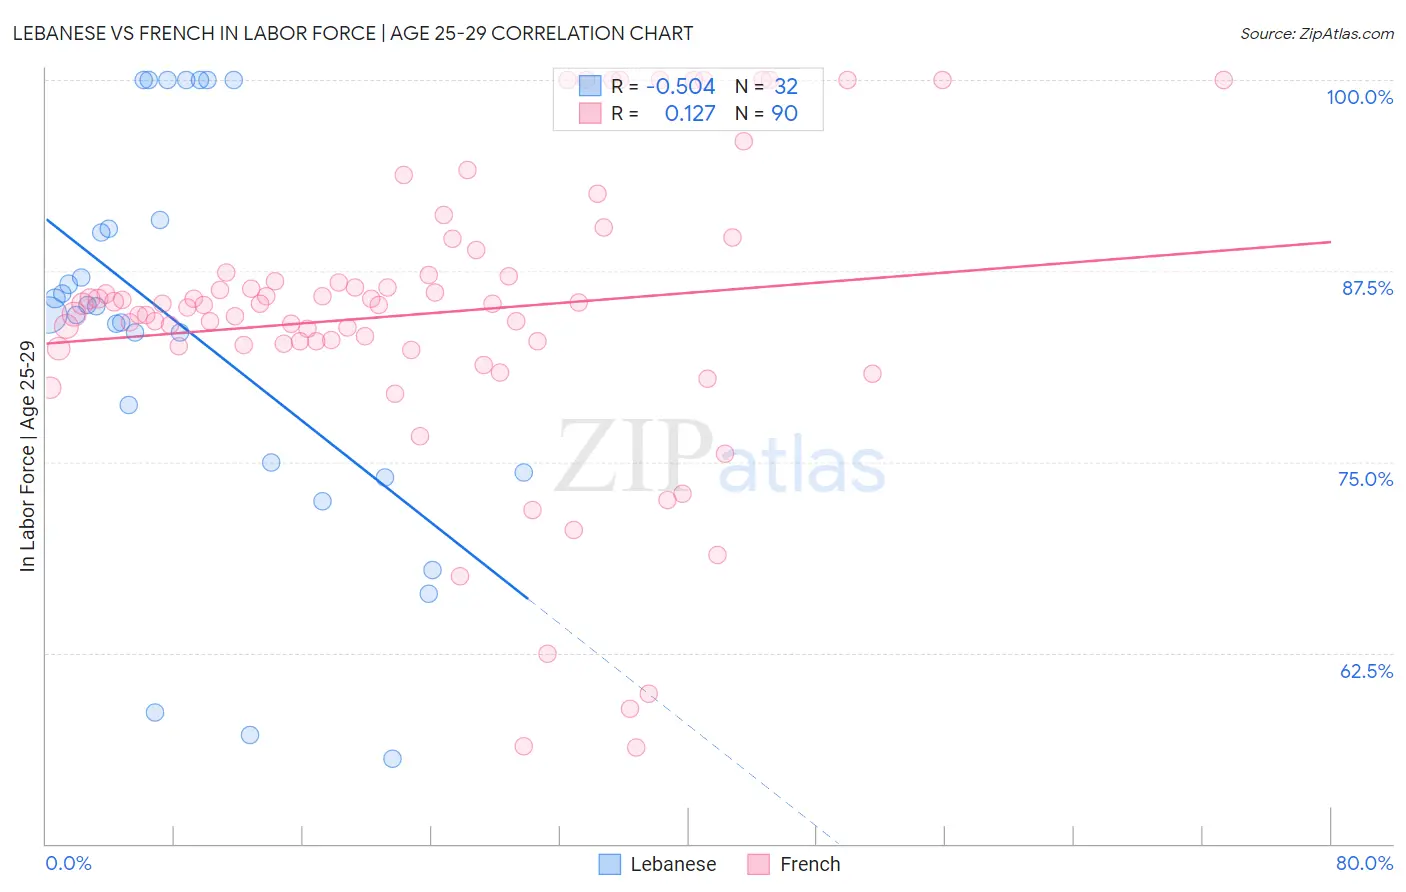
Lebanese vs French In Labor Force | Age 25-29 Correlation Chart
The statistical analysis conducted on geographies consisting of 401,455,455 people shows a substantial negative correlation between the proportion of Lebanese and labor force participation rate among population between the ages 25 and 29 in the United States with a correlation coefficient (R) of -0.504 and weighted average of 84.3%. Similarly, the statistical analysis conducted on geographies consisting of 571,081,449 people shows a poor positive correlation between the proportion of French and labor force participation rate among population between the ages 25 and 29 in the United States with a correlation coefficient (R) of 0.127 and weighted average of 84.7%, a difference of 0.47%.
In Labor Force | Age 25-29 Correlation Summary
| Measurement | Lebanese | French |
| Minimum | 55.6% | 56.3% |
| Maximum | 100.0% | 100.0% |
| Range | 44.4% | 43.7% |
| Mean | 83.5% | 84.7% |
| Median | 84.9% | 85.3% |
| Interquartile 25% (IQ1) | 74.7% | 82.7% |
| Interquartile 75% (IQ3) | 90.5% | 87.2% |
| Interquartile Range (IQR) | 15.9% | 4.5% |
| Standard Deviation (Sample) | 12.8% | 9.6% |
| Standard Deviation (Population) | 12.6% | 9.6% |
Similar Demographics by In Labor Force | Age 25-29
Demographics Similar to Lebanese by In Labor Force | Age 25-29
In terms of in labor force | age 25-29, the demographic groups most similar to Lebanese are Subsaharan African (84.3%, a difference of 0.010%), Japanese (84.3%, a difference of 0.010%), Immigrants from Syria (84.3%, a difference of 0.010%), Immigrants from Jordan (84.4%, a difference of 0.030%), and Chinese (84.3%, a difference of 0.030%).
| Demographics | Rating | Rank | In Labor Force | Age 25-29 |
| Immigrants | Armenia | 13.3 /100 | #207 | Poor 84.4% |
| Immigrants | Indonesia | 13.2 /100 | #208 | Poor 84.4% |
| Immigrants | Jordan | 12.8 /100 | #209 | Poor 84.4% |
| Chinese | 12.7 /100 | #210 | Poor 84.3% |
| Immigrants | Venezuela | 12.6 /100 | #211 | Poor 84.3% |
| Sub-Saharan Africans | 11.7 /100 | #212 | Poor 84.3% |
| Japanese | 11.4 /100 | #213 | Poor 84.3% |
| Lebanese | 11.1 /100 | #214 | Poor 84.3% |
| Immigrants | Syria | 10.7 /100 | #215 | Poor 84.3% |
| Israelis | 9.3 /100 | #216 | Tragic 84.3% |
| Immigrants | Ecuador | 9.3 /100 | #217 | Tragic 84.3% |
| Immigrants | Nigeria | 9.0 /100 | #218 | Tragic 84.3% |
| Immigrants | Saudi Arabia | 8.8 /100 | #219 | Tragic 84.3% |
| Nigerians | 7.2 /100 | #220 | Tragic 84.3% |
| Arabs | 6.8 /100 | #221 | Tragic 84.2% |
Demographics Similar to French by In Labor Force | Age 25-29
In terms of in labor force | age 25-29, the demographic groups most similar to French are Immigrants from Sri Lanka (84.7%, a difference of 0.0%), Indian (Asian) (84.7%, a difference of 0.0%), British (84.7%, a difference of 0.0%), Colombian (84.7%, a difference of 0.010%), and Immigrants from Pakistan (84.7%, a difference of 0.010%).
| Demographics | Rating | Rank | In Labor Force | Age 25-29 |
| Peruvians | 64.7 /100 | #149 | Good 84.7% |
| Swiss | 64.7 /100 | #150 | Good 84.7% |
| Colombians | 62.8 /100 | #151 | Good 84.7% |
| Immigrants | Pakistan | 62.7 /100 | #152 | Good 84.7% |
| Immigrants | Taiwan | 62.2 /100 | #153 | Good 84.7% |
| Immigrants | Sri Lanka | 61.7 /100 | #154 | Good 84.7% |
| Indians (Asian) | 61.6 /100 | #155 | Good 84.7% |
| French | 61.0 /100 | #156 | Good 84.7% |
| British | 60.4 /100 | #157 | Good 84.7% |
| Immigrants | Ghana | 60.2 /100 | #158 | Good 84.7% |
| Immigrants | Western Africa | 60.1 /100 | #159 | Good 84.7% |
| Immigrants | Peru | 58.6 /100 | #160 | Average 84.7% |
| Canadians | 58.5 /100 | #161 | Average 84.7% |
| Immigrants | Colombia | 58.3 /100 | #162 | Average 84.7% |
| Argentineans | 57.9 /100 | #163 | Average 84.7% |